If you find value from my hard work below, please do consider sharing/subscribing and also following me on Twitter where I also post lots of useful charts and data.
If you picked up last weeks letter, you’ll already know I’ve laid out what I believe is going to be the catalyst for a leg lower in the markets.
We’re getting close to the early innings of that thesis starting to play out so I won’t cover old ground in this weeks letter.
But I’d encourage you to check that out.
But as we’re heading into a long weekend, lets start this weeks letter with a quick glance at sentiment.
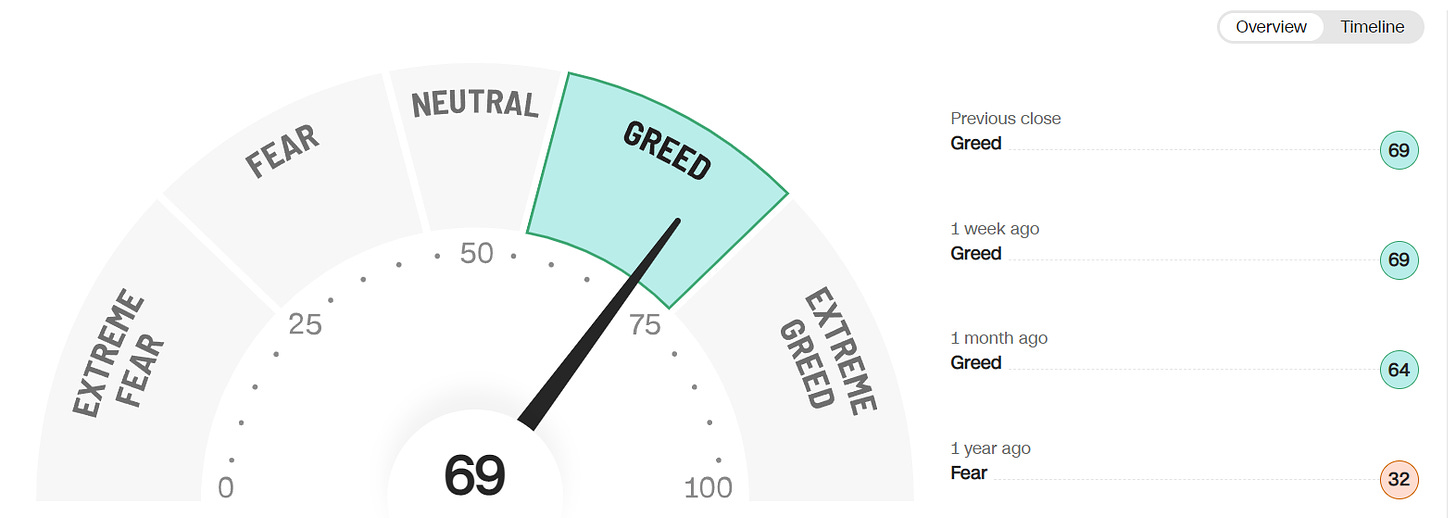
Fear and Greed Index
In the last couple of weeks, sentiment has gotten a little over-crowded.
The market’s been ripping higher since October, and Tech’s also been on a rocket ship these last few weeks.
Despite the fact we’re only 6 weeks into 2023, hopefully you have a % number you’re happy with for the year.
That’s important because it gives us a good reason to step back and ask ourselves if we’re also getting a little greedy in what’s starting to become a tricky market environment.
If we’re overly bullish and it’s getting tricky, I don’t see the harm in asking a few more questions and digging a little deeper.
Dollar Index vs VIX
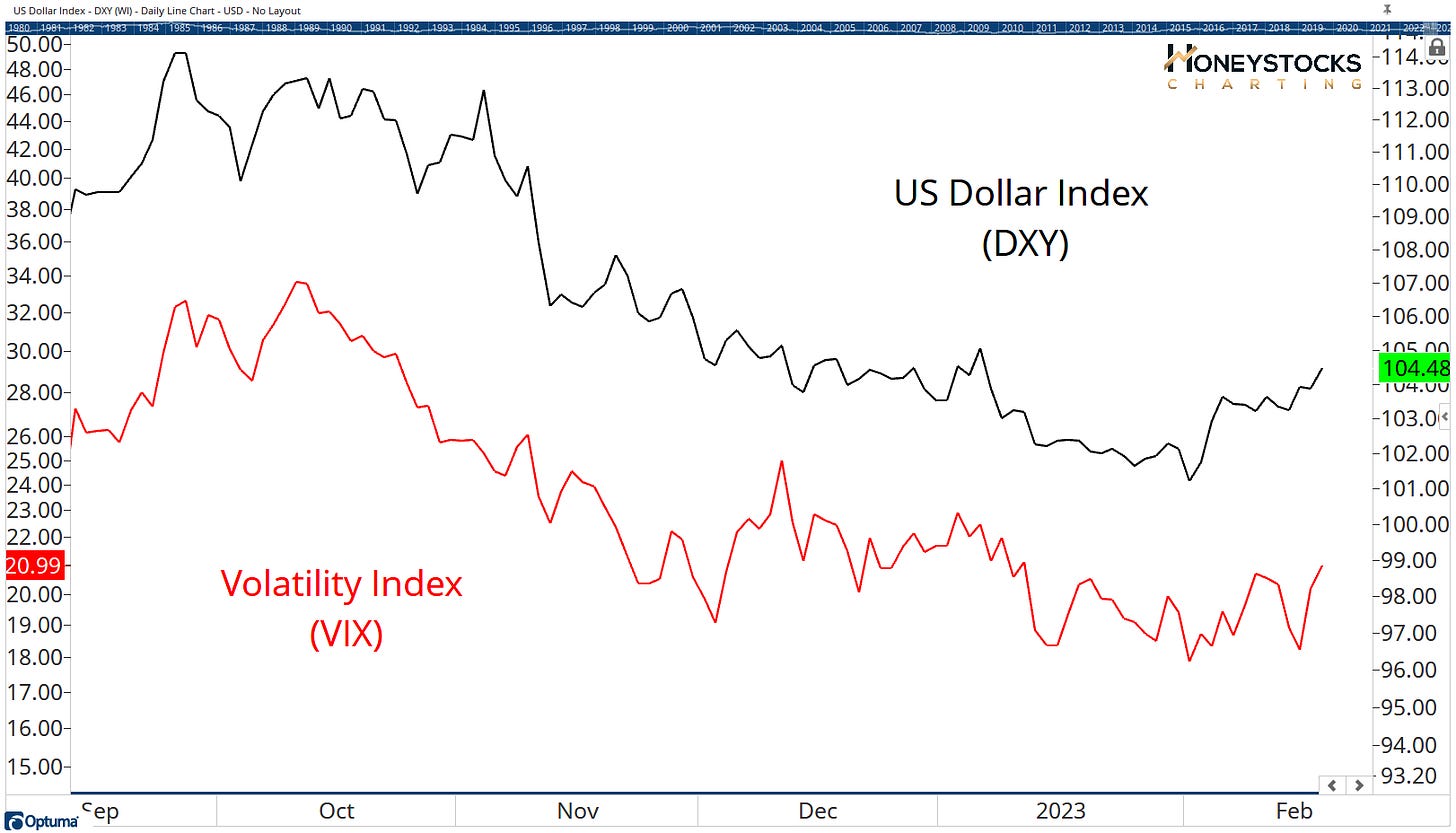
I’ve already covered the US Dollar to death, but I’d like to add another chart that I think’s worth paying attention to because at the very least, the chart above tells us to be extremely careful with new positions if the DXY continues motoring higher.
What would a rising DXY and VIX mean for stocks?
Since I’m based in Europe, lets compare European stocks with the US Markets.
FTSE 100 Index
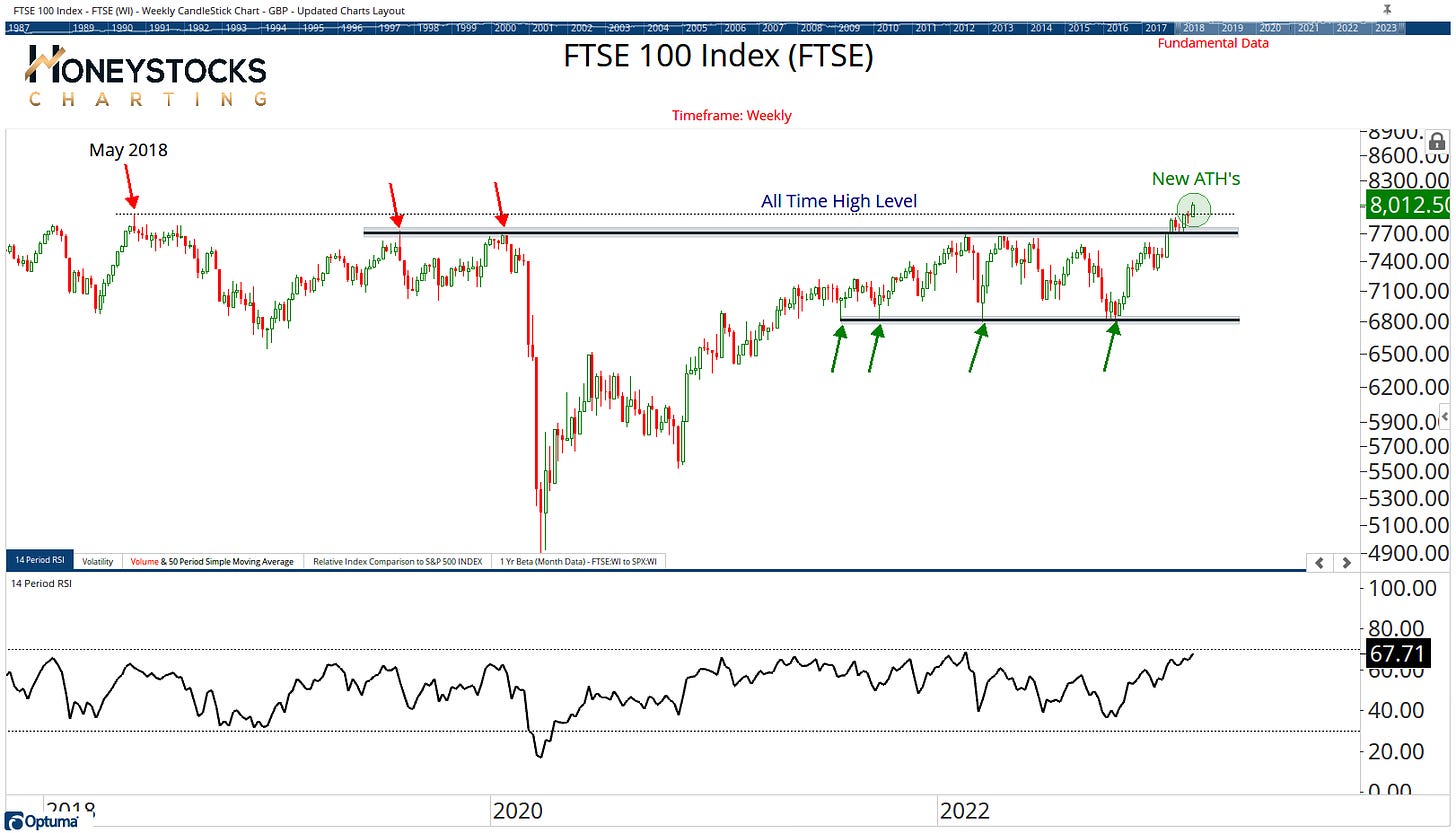
We currently have rocket fuel blasting us through to ATH’s in the UK and we’re now above 8,000.
Blue skies ahead for the UK?
Euro STOXX 50 Index
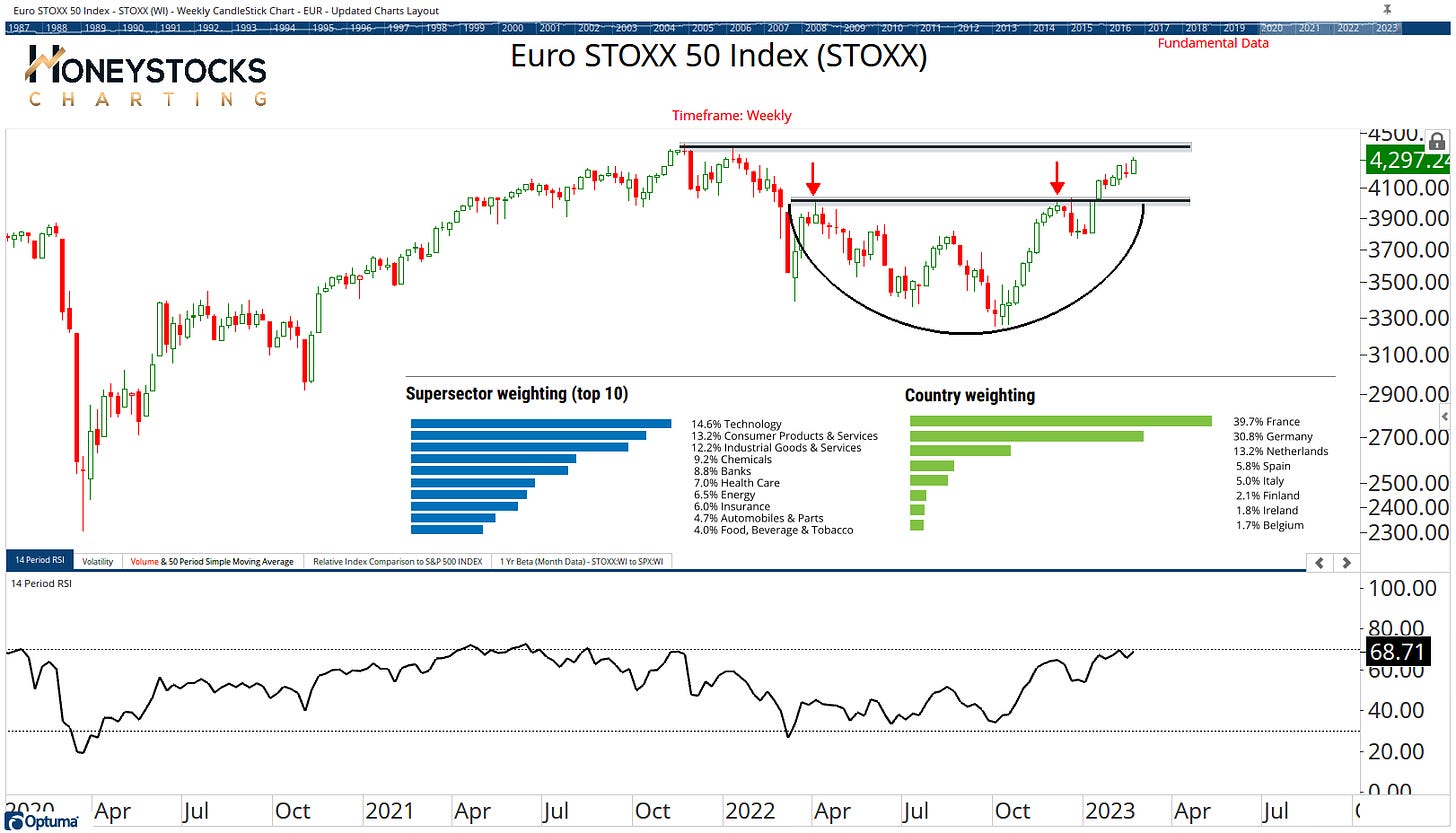
Europe continues to lead the way with the Euro 50 Index now approaching upside objectives… what would a break out here mean for Europe?
But what about the US Markets?
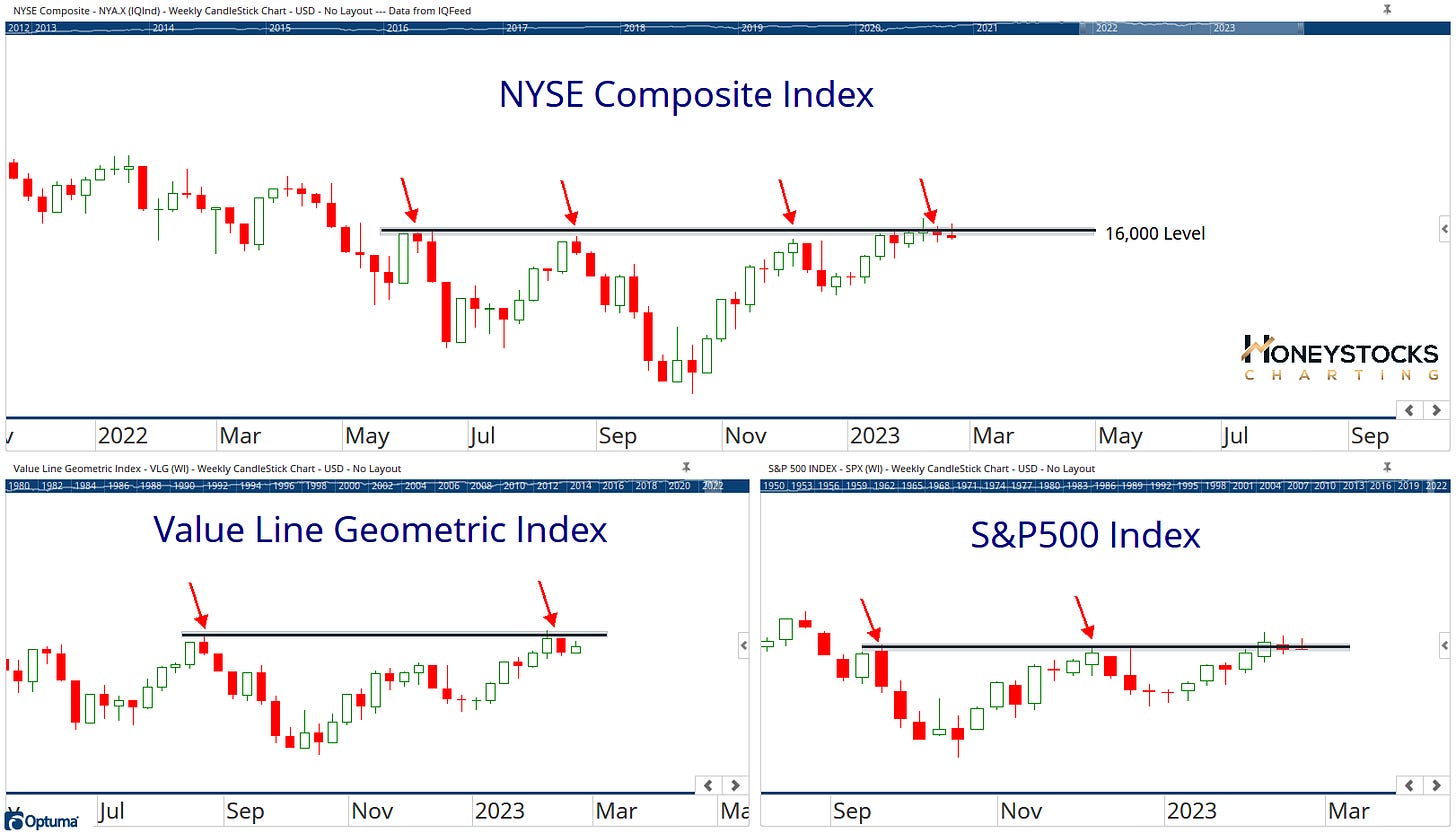
Key Indexes (NYA, VLG, SPX)
We’re pushing against logical pause levels across the board.
The charts tell us it’s becoming increasingly more difficult to identify stocks that are offering clean entries as many areas are now beginning to chop.
For complete clarity, and just so we’re all get on the same page, unlike the Captain Hindsight brigade, we started turning bullish on stocks in October last year and it ultimately marked the bottom for this phase of the market.
That letter can be found here - October Letter Here.
But like I’ve laid out these last 2 weeks, it’s now getting increasingly more tricky.
In Conclusion
I don’t make predictions on whether we will ultimately collapse or continue ripping higher.
Predictions are what you can tune into the clown shows at CNBC or Bloomberg for.
I prefer to work with a weight of the evidence / risk vs reward approach coupled with systematic process
Do we take the foot off the gas peddle and pull in to the side of the road or do we continue launching 100mph down the freeway?
As I write this 1hr into the market on Friday 17th Feb, I tend to lean toward the former but that also doesn’t mean we sell glorious uptrends in stocks Like TSLA or NVDA until our systematic risk management process tells us the trend is over.
Tesla Chart (Premium Alert From Jan 3rd)
How do you see it?
Let me know in the comments.
Please do consider Subscribing and Sharing with like-minded folks. It’s free.
Alternatively, feel free to check out all our Premium Membership Options below.


