If you’re new to my letter this week or don’t follow my work all that closely because you’re following a million other folks and bombarded with information and analysis, I said something on X a few weeks ago that probably hasn’t endeared me to the Fin-Twit Technical community.
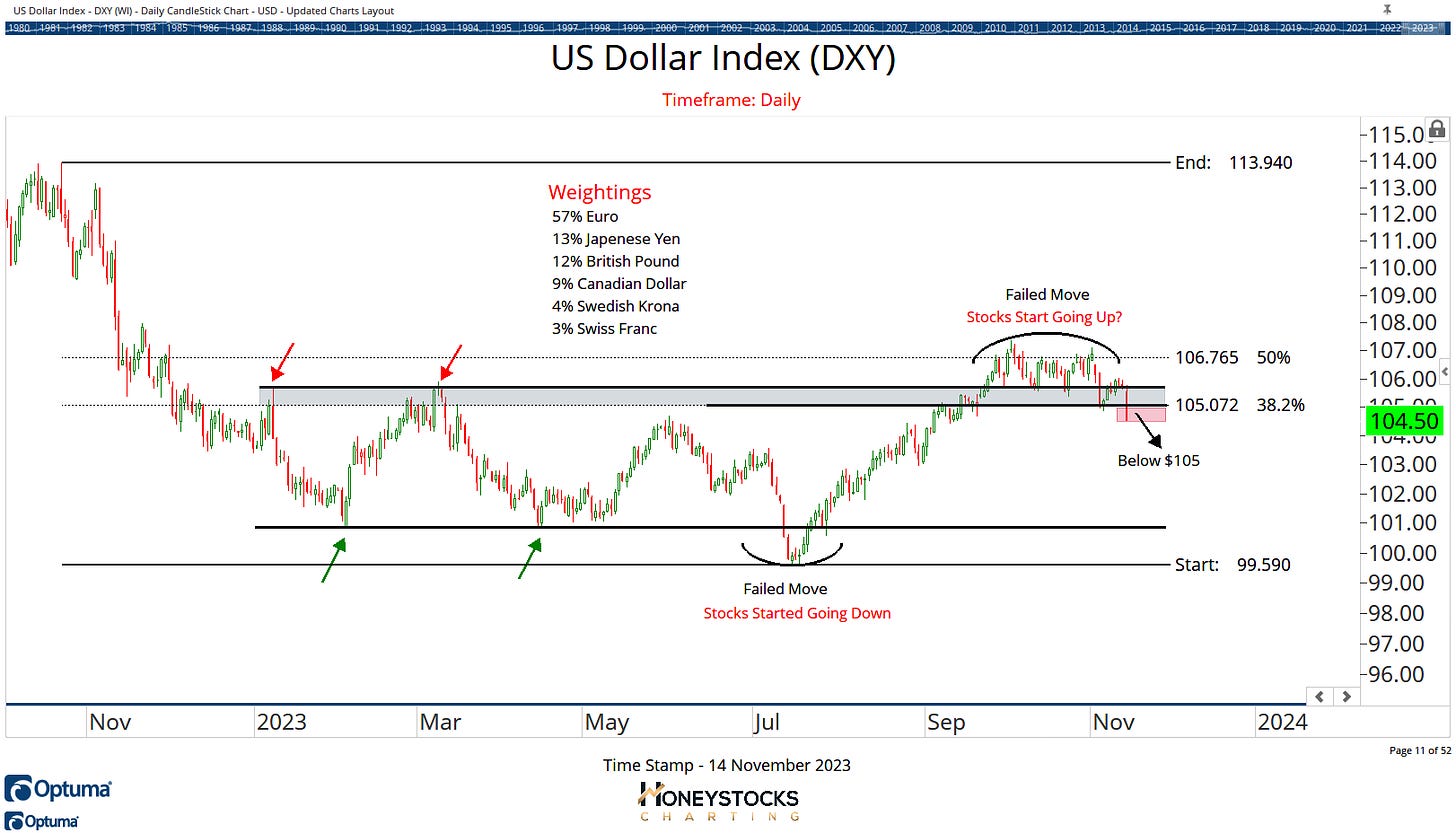
Since that tweet, there’s been ANOTHER unbelievable opportunity, and my hope is that everyone who picks up this free weekly letter every week, the message to consider buying good quality stocks / ETF’s over the last few weeks in the face of a declining US Dollar and a potential top in rates has been fruitful for you.
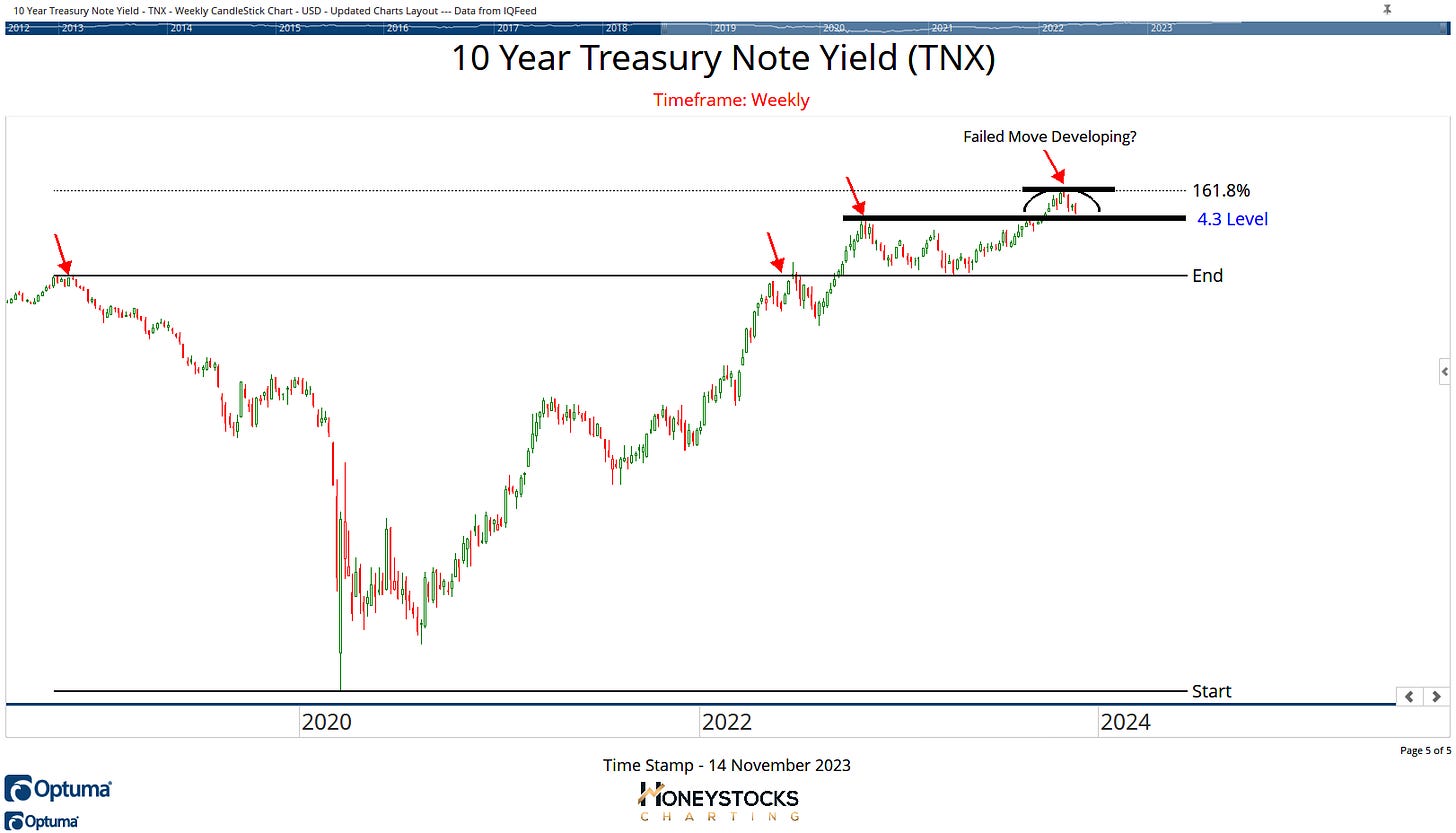
Since I’ve covered these charts previously, here’s an update on the 2 most important charts in finance, with some accompanying performance data.
10 Year Note Yield (TNX)
US Dollar Index (DXY)
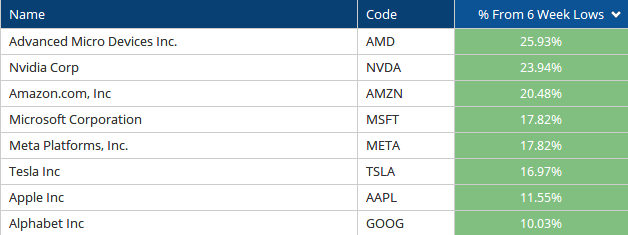
Select Mega Cap Performance
Waiting for all time highs and relative strength to show up on great solid stocks/companies when you’ve identified a tradeable market bottom coming out of a crash or correction is dumb, it’s really really REALLLLLLY dumb.
For disclosure: We’ve been covering for our members the rebounds in MSFT, TSLA, AMZN, META, NVDA and AAPL
The US Dollar has been the key for stock direction for years so it’s absolutely zero surprise to see the S&P500 moving higher since the failed move.
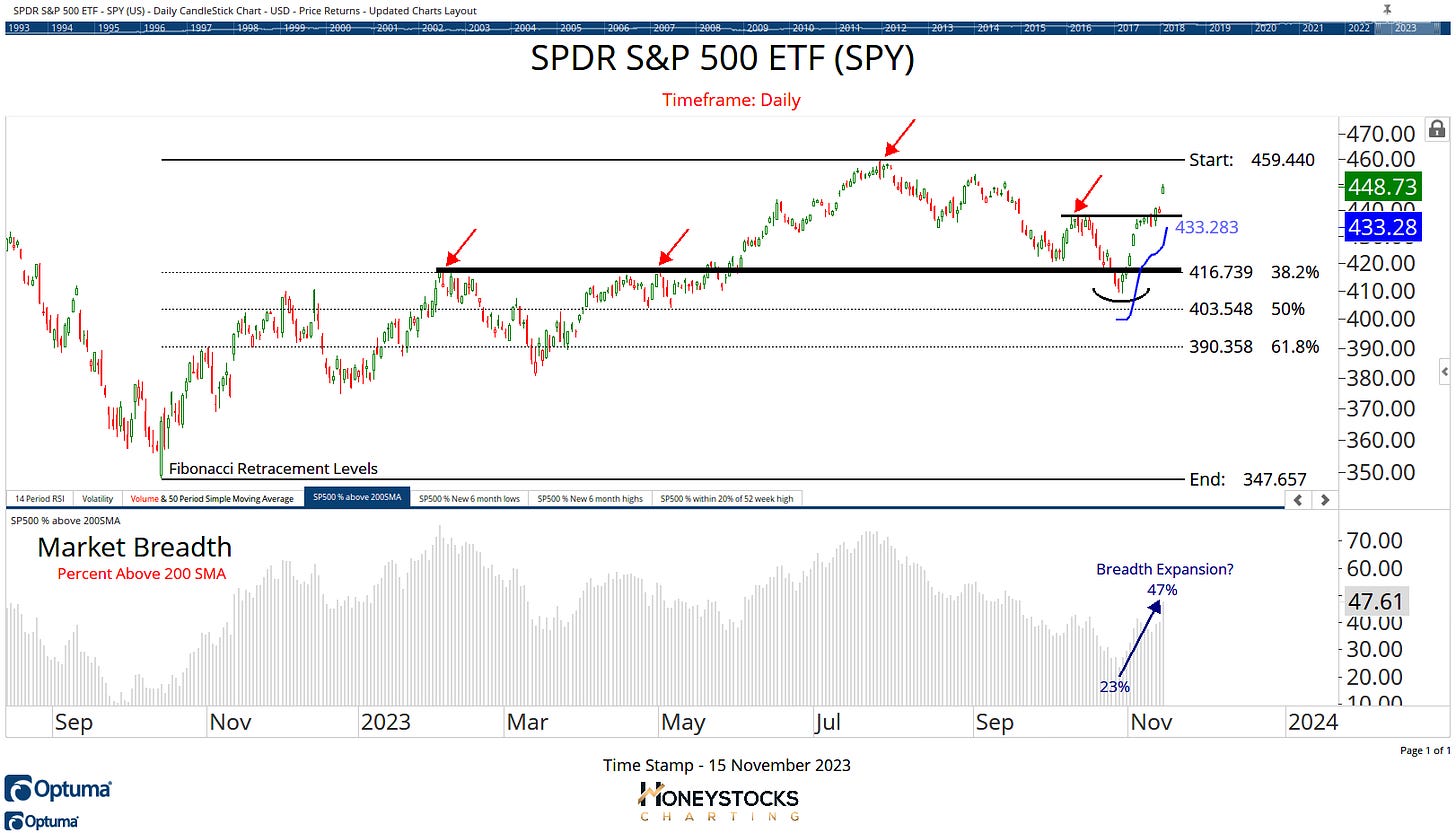
SPDR S&P500 ETF (SPY)
I posted the above chart to X at the weekend and had a little bit of a snarky back and forth with 1 of the “up his own arse” relative strength CMT gurus.
To explain the chart, it’s simply telling me my thesis on a lower dollar and lower rates is being confirmed by expanding “under the surface” market breadth.
The only measure of competence IS competence, with a concise history of time stamped work.
Buy Low : Sell High Examples
Tesla Inc (TSLA)
Tesla is 1 of our current high conviction ideas and it’s rebounded exactly when it was supposed to… 2 weeks ago.
The problem with these type of charts is you can’t scan for them as they’re not breaking out, but if you do struggle with when to buy low, understanding the history of the chart helps.
I don’t treat declines in the likes of MSFT, TSLA, AAPL etc the same as I would a $2B growth tech stocks, that would open up the possibility of catching a falling knife and it would be crazy.
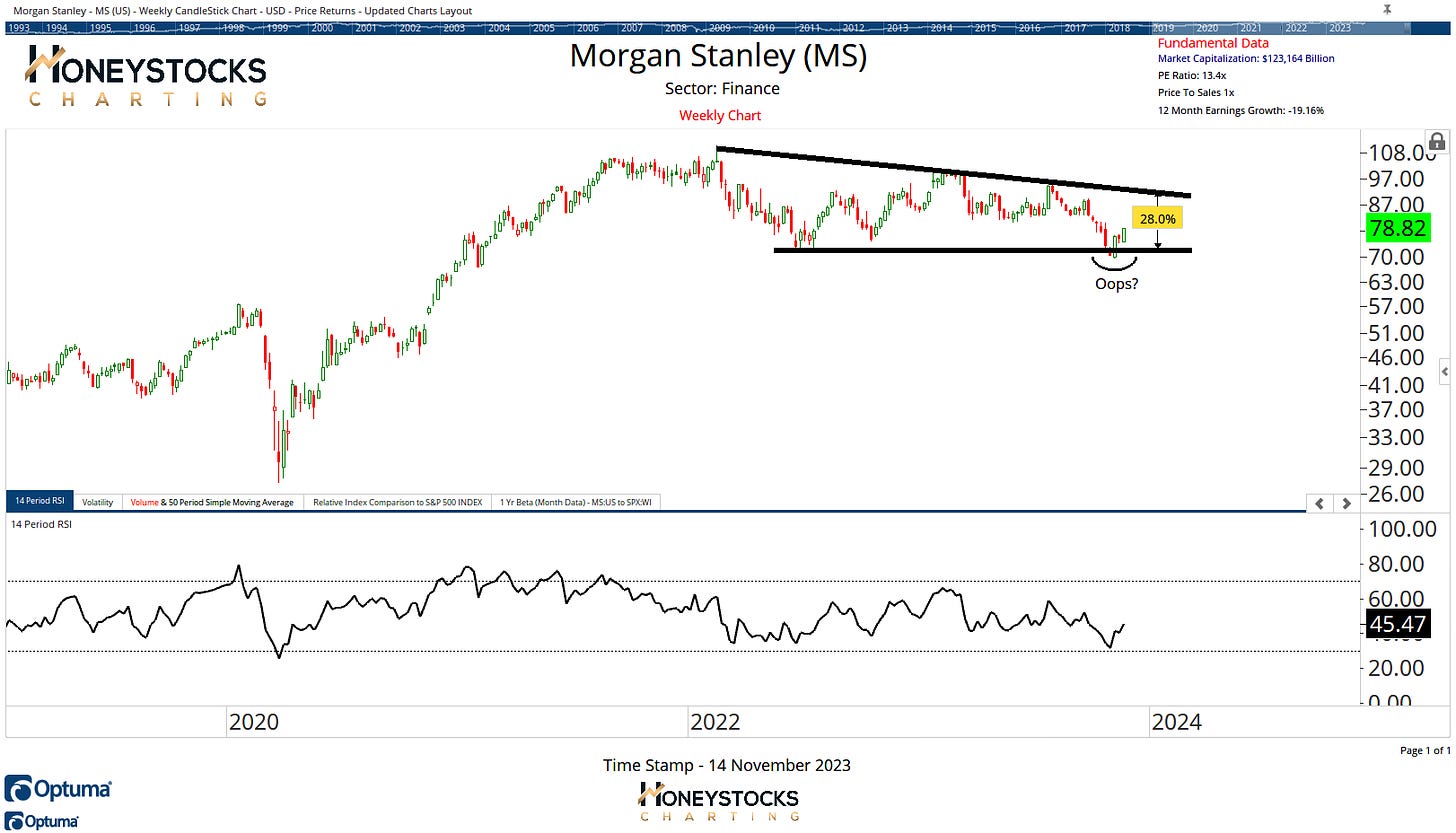
Morgan Stanley (MS)
Morgan Stanley is 1 of the current 50+ individual bullish charts in our members chart book just now. Again, massive company in the finance space which has already rebounded exactly where it should have.
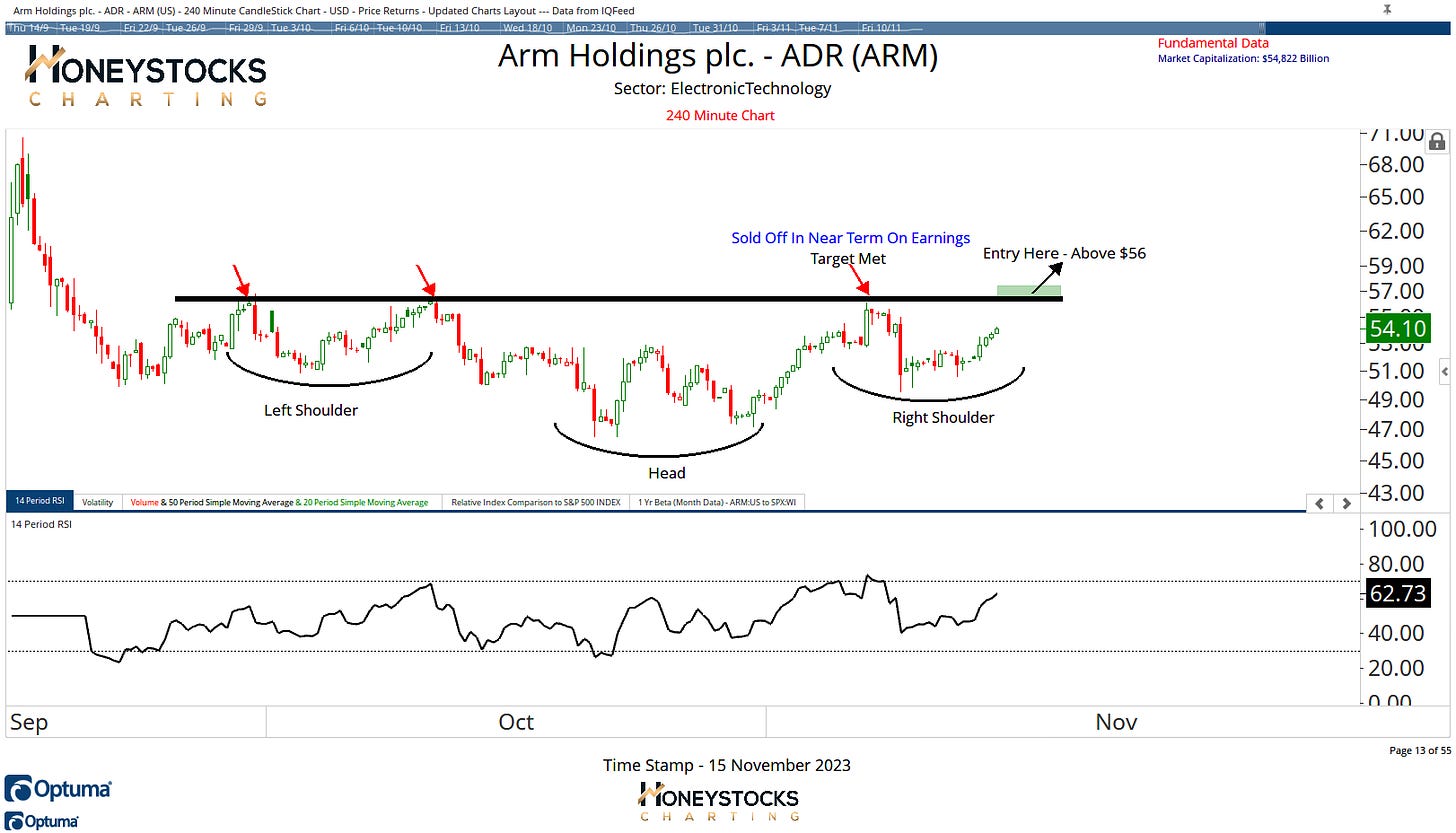
Arm Holdings PLC (ARM)
We’re also looking at potential opportunity in 1 of the recent IPO’s and ARM is potentially setting up and I’ll be watching that $56 level with a lot of interest.
In Conclusion
There’s a lot of opportunity out there. We currently have around 60+ bullish individual stocks in our members chart book with another 20 ETF’s that are rebounding from logical price levels.
There are MANY more stocks than the “it’s only 7 stocks brigade” will have you believe.
If you’ve missed out on some of the massive rallies over the last few weeks in the mega cap space because you keep being scared out the market by mainstream financial media and the perma-bears, perhaps I can draw your attention to our premium work below which has a Black Friday Offer running for a few days.
Have a great week / weekend, see you next week sometime.
Access All Our Premium Work - Link Below





great article and analysis Sam!