So, 2024’s off to a bit of a choppy / rocky start isn’t it?
At least that’s the case if you only pay attention to the major averages.
I’m a sector by sector, stock by stock kinda guy so I prefer to dig in and put the hard yards in when everyone else around me is losing their minds so in this weeks letter I’ll try to give some context to what the market’s doing using charts and logic.
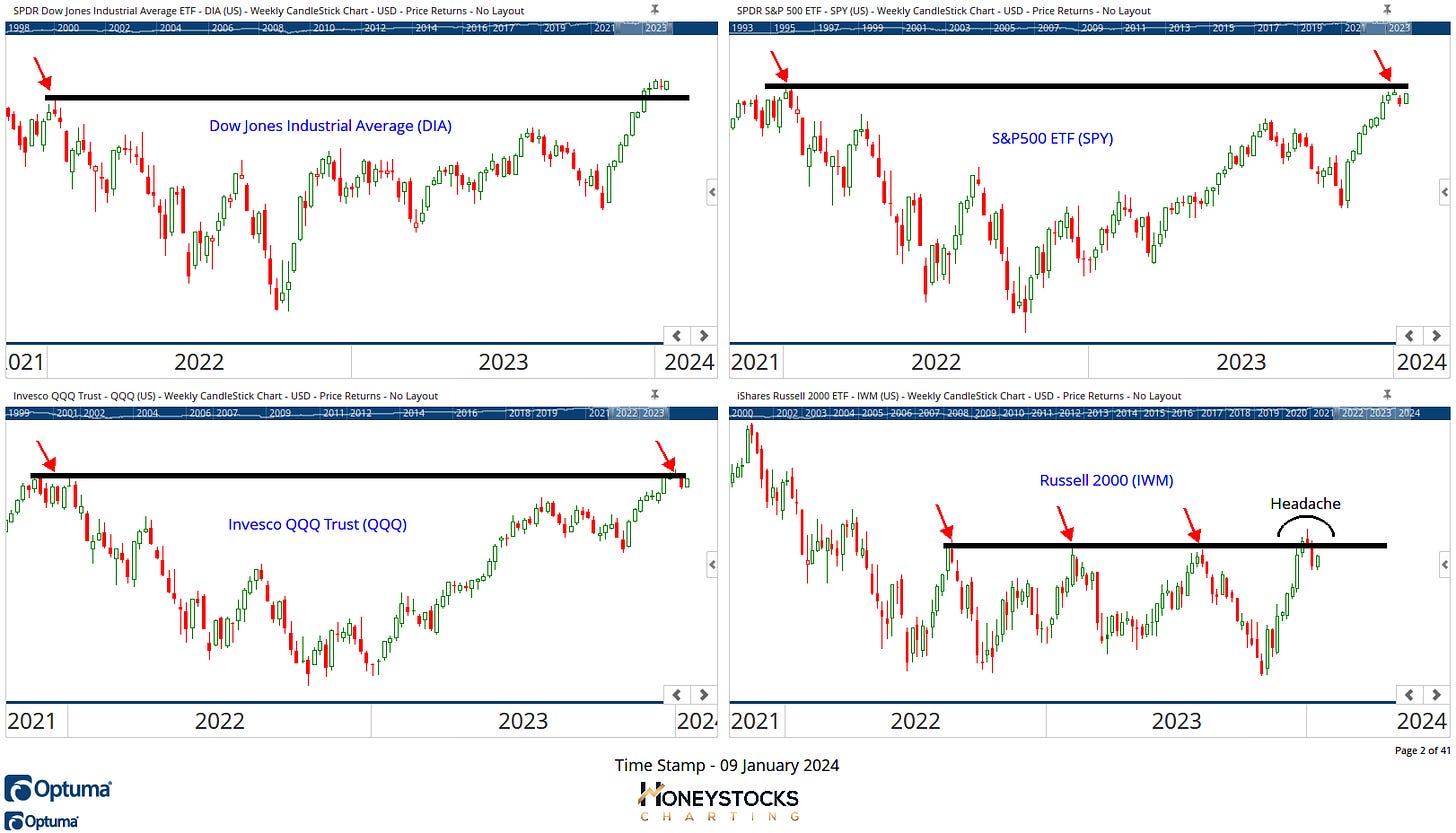
Since many of you like the major averages, here’s an update to last weeks letter, my 1 chart snapshot.
1 Chart Snapshot (US Markets)
Nothing’s really changed, we’re still pushing against key levels across the board, but what’s very noticeable to me is the minor headache I have with the small caps just now.
We’ve had a relatively significant 6% pull back in the Russell 2000 from its recent highs and whenever 1 of the major averages put in a dreaded failed break out, I always have concerns that 1 of these charts could ultimately lead the rest.
I also like to pay attention to the CMT’s and my internal Twitter sentiment indicator.
Twitter Sentiment: When the FinTwit CMT’s get a little cocky and arrogant, I begin looking at it from the opposite perspective. It can help a lot.
S&P500 ETF (SPY)
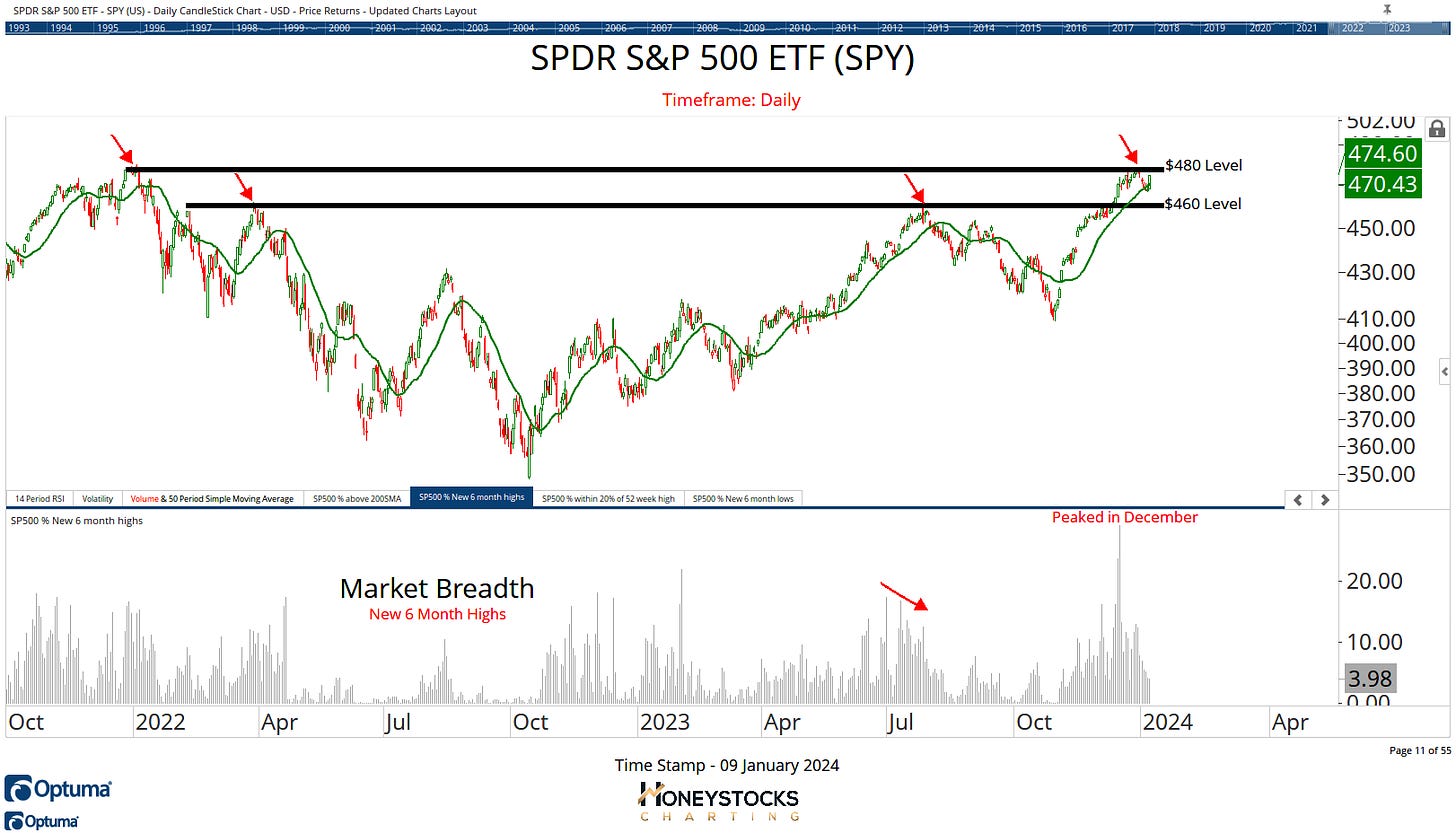
Unless you’re some kind of perma-bear addicted to pain, I think we’d all prefer a break out to new all time highs wouldn’t we?
I’ve added breadth data to the chart this week and what’s noticeable from the data is stocks stopped going up last month.
That’s not my thoughts and feelings, that’s just what the data says.
Is it a perfectly healthy pull back and buy the dip opportunity?
US Dollar Index (DXY)
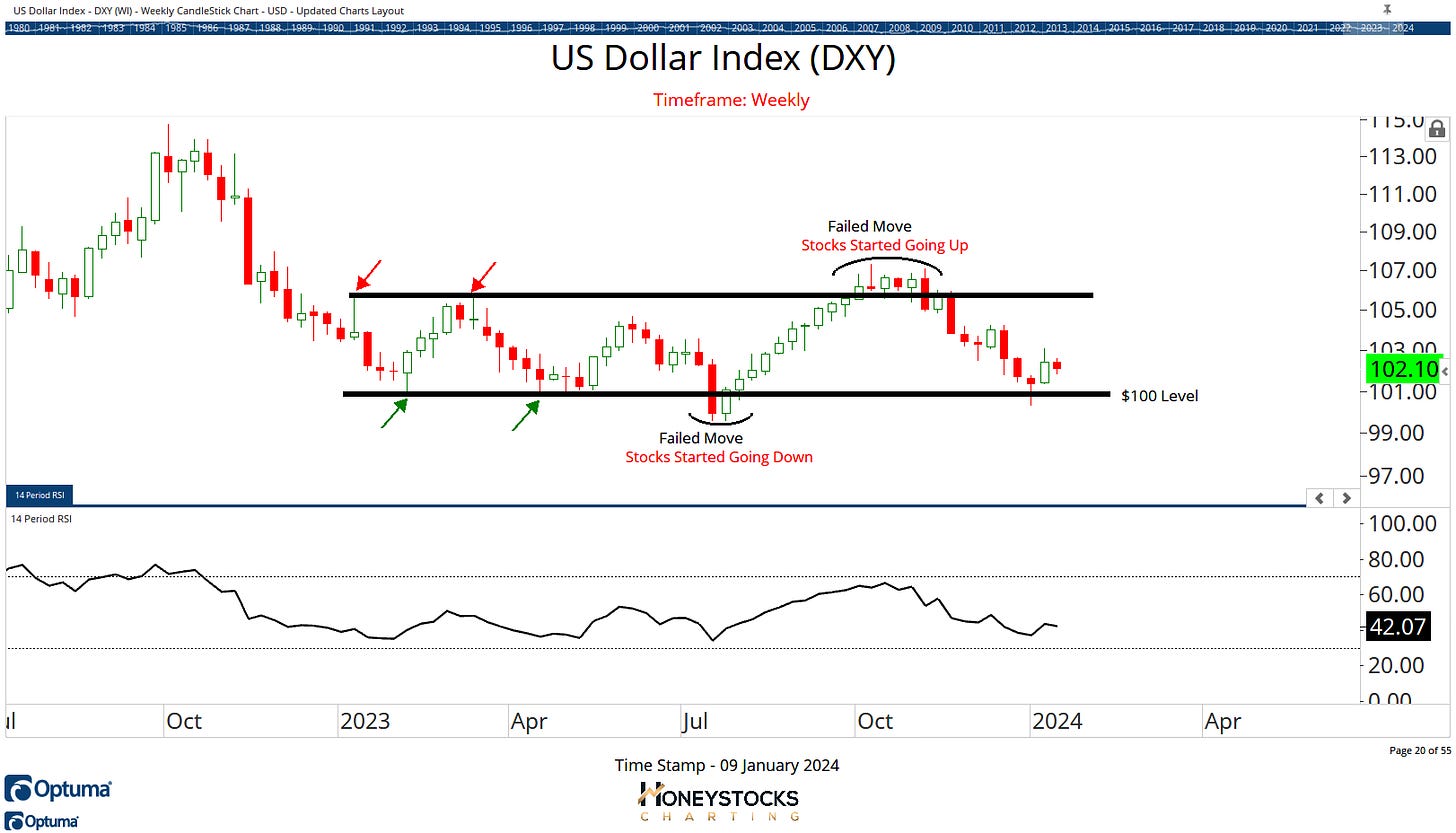
The key remains the US Dollar and to update another of the charts presented last week, notice how most stocks struggled last week when the dollar rebounded from logical levels?
Don’t get it twisted though, not all stocks will struggle on a higher dollar, which is why I go sector by sector, stock by stock, but it’s definitely worth paying attention to what the dollar chart does here.
Speaking of stocks. I know what you need… you need another Nvidia chart in your life. There hasn’t been enough of them posted across Twitter the last 24hrs.
Nvidia Corp (NVDA)
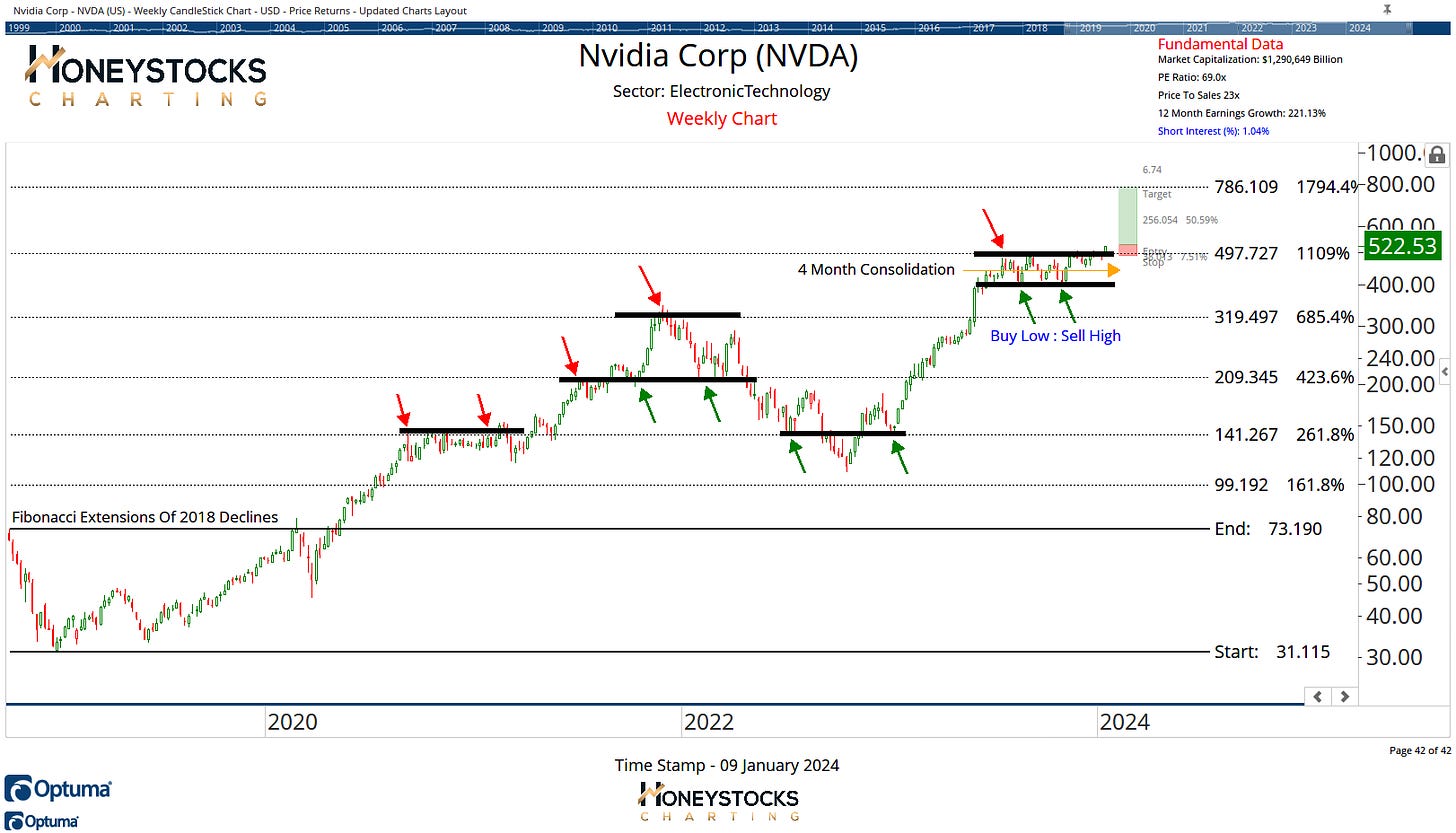
Not everyone likes buying stocks at all time highs, in fact, many of my clients / members much prefer my buy low : sell high charts and NVDA has been just that over the last 4 months.
But now it’s breaking out above $500 Round Number and if you subscribe to the idea Fibonacci levels matter (I believe they do), there’s a 6:1 Risk:Reward proposition to be had.
Cboe Global Markets Inc (CBOE)
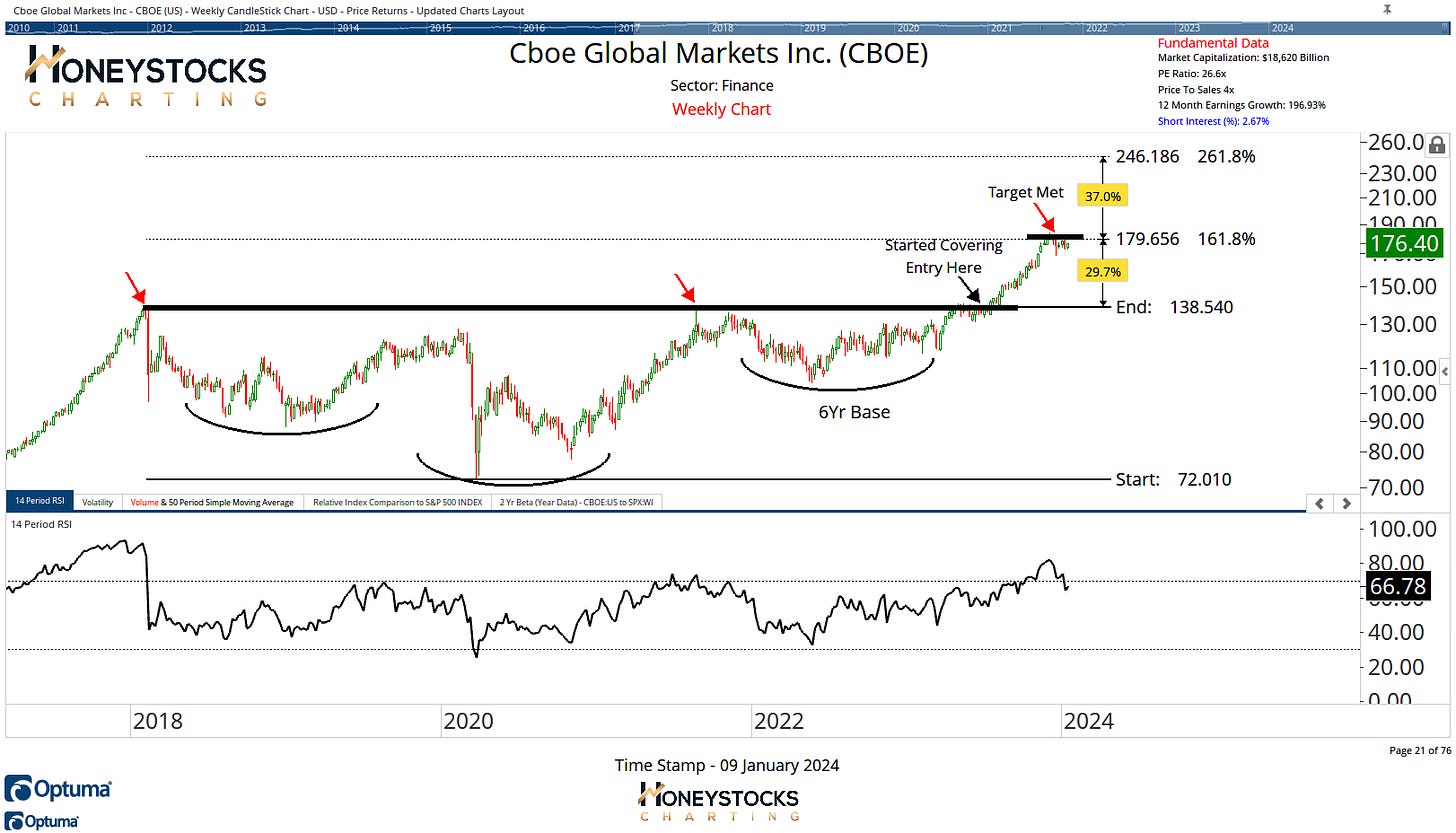
Another of our premium charts recently met our upside targets (another example of why I use Fibonacci in my work), but a move above $180 might offer an entry with some lofty upside objectives?
Apple Inc (AAPL)
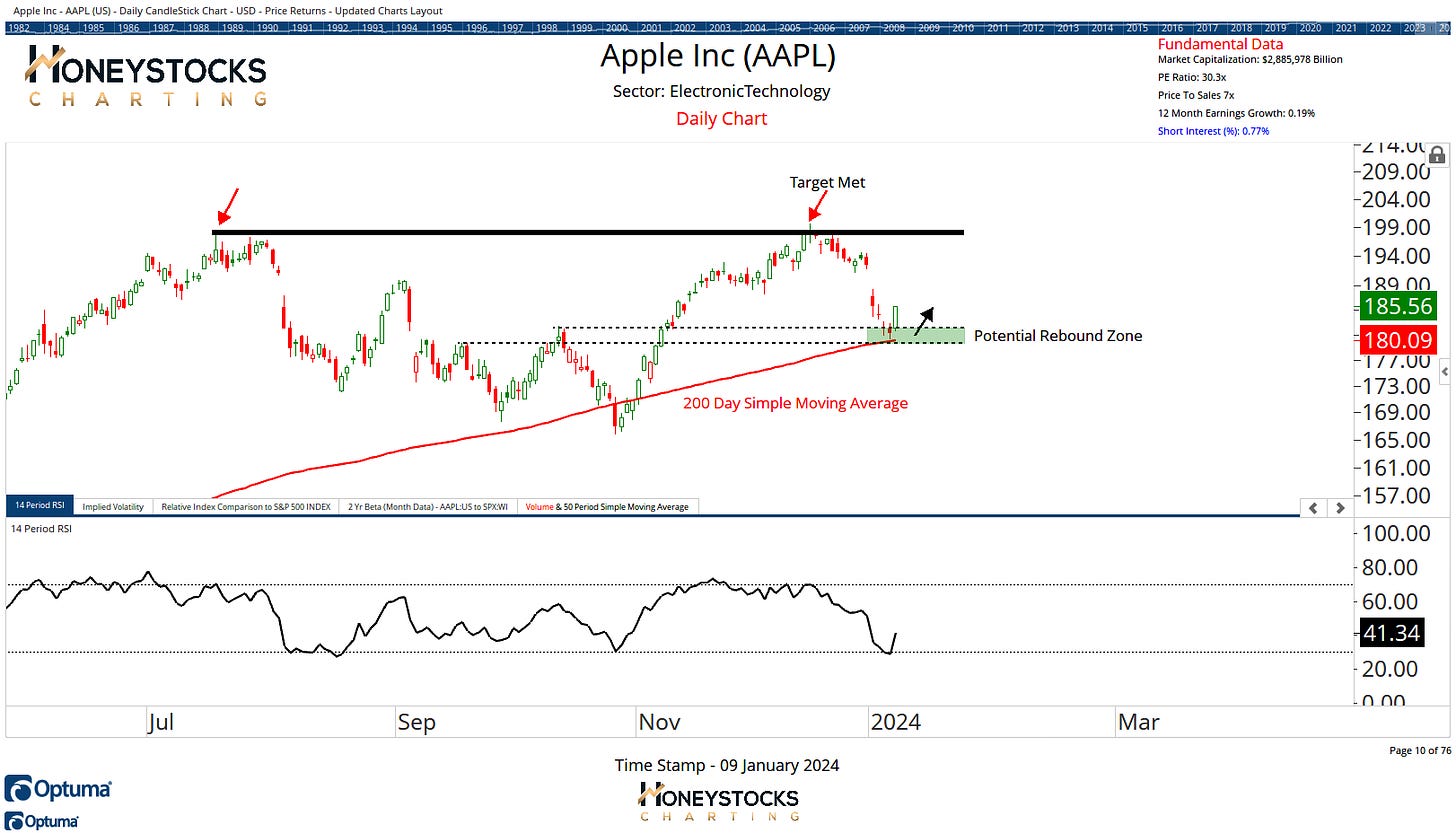
Apple rallying on news of a 30% decline in iPhone sales in China makes perfect sense, especially when you use technical analysis.
Bullish above the 200 Day Simple Moving Average and not so bullish below?
In Conclusion
Honestly, I’m very on the fence about market direction just now because I don’t really have much conviction in the averages at current levels.
That’s coming from someone who’s been bullish stocks since the market bottom in October 2022 by the way.
I’m still providing bullish charts to our clients and members just now because the Dow Jones is holding onto it’s all time highs, but it’s a day by day thing and I’m ultimately just treating each chart on its own merits.
Plenty of stocks will continue to act just fine, even if the indexes get a little sloppy so I’ll just focus on what’s working and potentially rebounding.
If the Dow fails, that’s still the signal to get full on defence mode.
These are just 6 of the 30 charts I presented last weekend in our premium work in addition to the 100’s of stocks, ETF’s and Commodities we’re covering in our chart books.
I’d recommend checking that out below.


