During a month where 1 of our clients hilariously told me he trusts my charts more than he trusts his wife and kids, my attention is now focussed on whether the Tech correction we’ve had is as bad as it gets.
In this weeks letter I’m going to get into whether we can start to buy some discounts.
But it makes sense to start with those recent Tech decline numbers -
XLK -10% from its highs
RSPT -9% from its highs
QQQ -8% from its highs
With all the doom mongers telling everyone THE Armageddon event is still upon us, charts right now, for me, are more important than ever.
If you follow my work closely, you’ll already know I’ve covered August/September seasonality and to expect some chop and you’ll also know I’ve highlighted the rising dollar and the failed break out in Tech, so I hope my work has continued to serve you in some positive way.
Lets start this week with volatility because I think there are some clues here, and it’s a chart I covered at the weekend with our clients/subscribers.
Volatility Index (VIX)
The VIX get a lot of air time, but while volatility is being suppressed and within its usual range (and Sub 20), that’s probably an environment that lends itself more to a healthy pull back thesis rather than an Armageddon thesis.
But let me be clear, there’s a bunch of charts just now with contradicting messages.
There’s not enough space here to get into them all but while volatility continues to be suppressed, I think the market’s fair game for buying opportunities.
Not just Tech dip buying opportunities.
How about buying Uranium stocks in the current chop?
Uranium ETF (URNM)
URNM is potentially breaking out of a 2yr consolidation pattern.
URA is the other (bigger) ETF, which is also flirting with upper range levels.
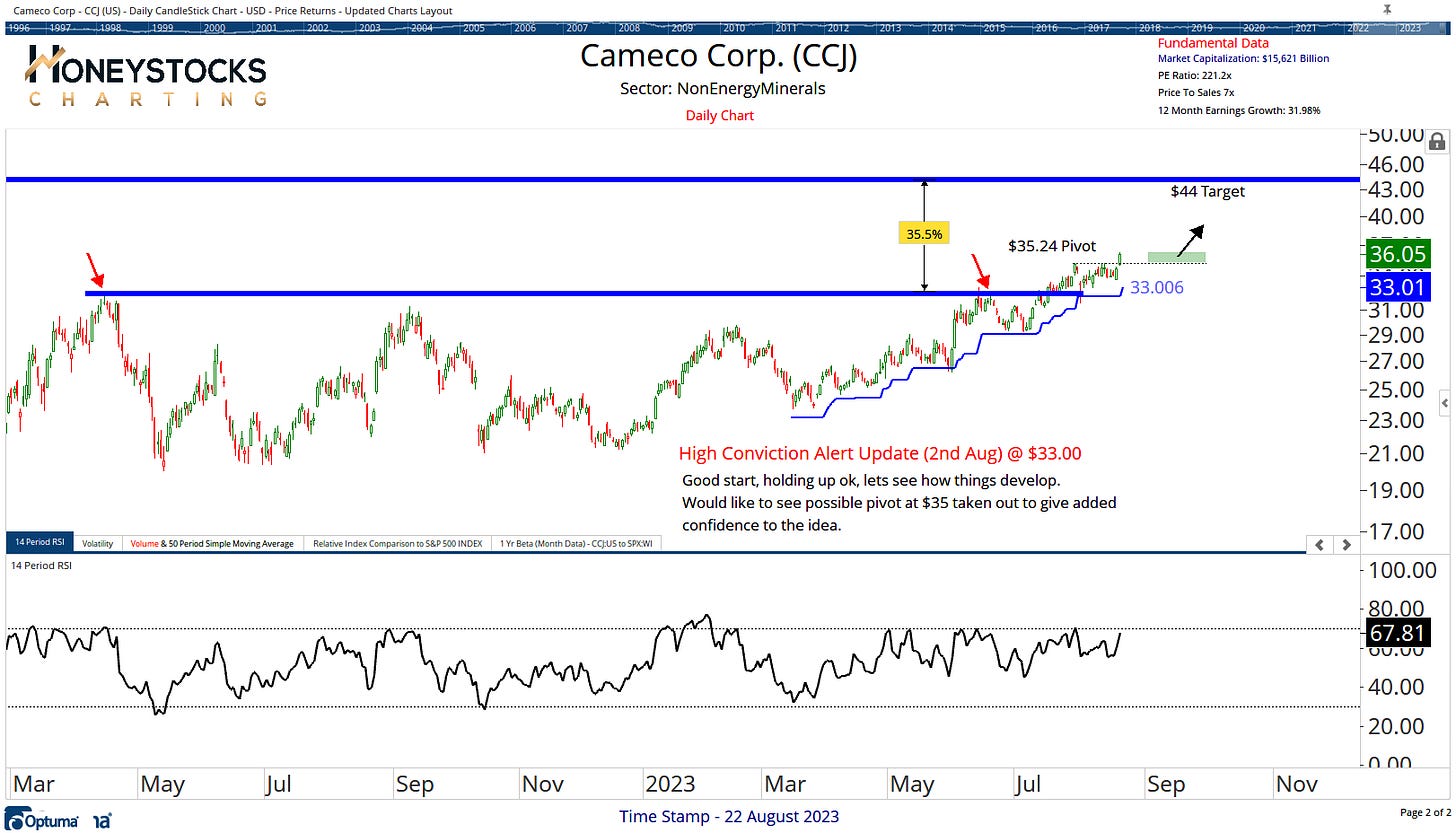
We’ve been bullish Uranium name Cameco Corporation for a couple of weeks now since it published earnings.
Cameco Corporation (CCJ)
Cameco Corp is already +10% for our subscribers.
There is still the potential for a further $8 per share upside, but for disclosure, positions for us are already de-risked and our trailing stop is already beyond entry prices.
It’s now a risk management game. If the market DOES collapse, it’s not a problem.
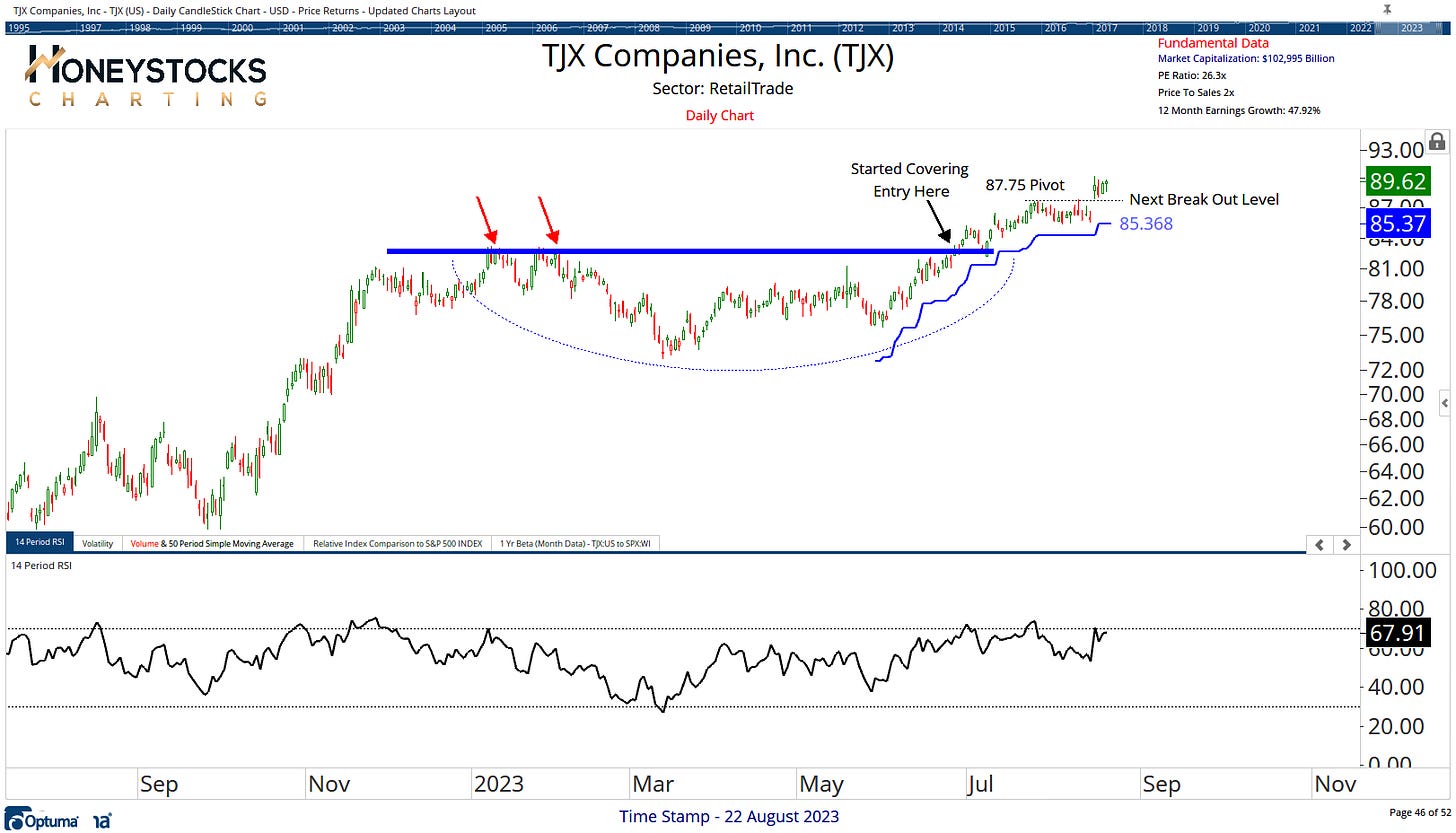
TJX Companies (TJX)
How about retailers like TJX, is it breaking out again?
The negative with the above chart is the CEO cashed out $4m worth of shares this week so it’s more of a risk management game, but again, it is trending higher, we have upside targets of $100.
I also laid out a bunch of charts at the weekend via our YouTube Channel.
If you enjoy logical analysis free of confirmation bias and clown show opinions, you might find some value therein.
In Conclusion
I remember a time when being correct with a thesis (and timing it well) was a source of pride on Wall Street.
Social media changed the landscape forever and the best analysts are no longer on Bloomberg, CNBC or even at the Investment banks.
But unfortunately, it’s now full of the click bait clowns masquerading as professionals.
In a world where everyone tries to convince everyone else they definitively know what comes next, nobody wants to say they don’t know what comes next, which always the correct answer.
So pay attention to who you you’re paying attention to.
Weight of the evidence, and each chart on its individual merits is how it is.
In the next few days, you’ll probably see lots of folks highlighting the strength in the likes of Moderna, Tesla, AMD etc… these folks are already late.
How do you see things playing out?
Click below to access all our premium work and charts in real-time.


