If you find value from my hard work below, please do consider sharing/subscribing and also following me on Twitter where I also post lots more useful charts and data.
If you picked up last weeks letter highlighting the elevated likelihood of some market declines, I of course hope my work helped in some way.
You can find that here - 10th March Letter - Where Do We Go From Here
The current tape “feels” like a standard corrective phase with the accompanying chop.
Volatility (for me) isn’t a whole lotta fun because its the market’s way of getting you to take your eyes off the overall trend. At least that’s how I see it.
I’m not a very good day trader so I prefer to stick with systematic process that can absorb volatility, it’s just easier that way. (examples below)
Anyway, lets get into this weeks charts and data.
Growth / Value / Tech
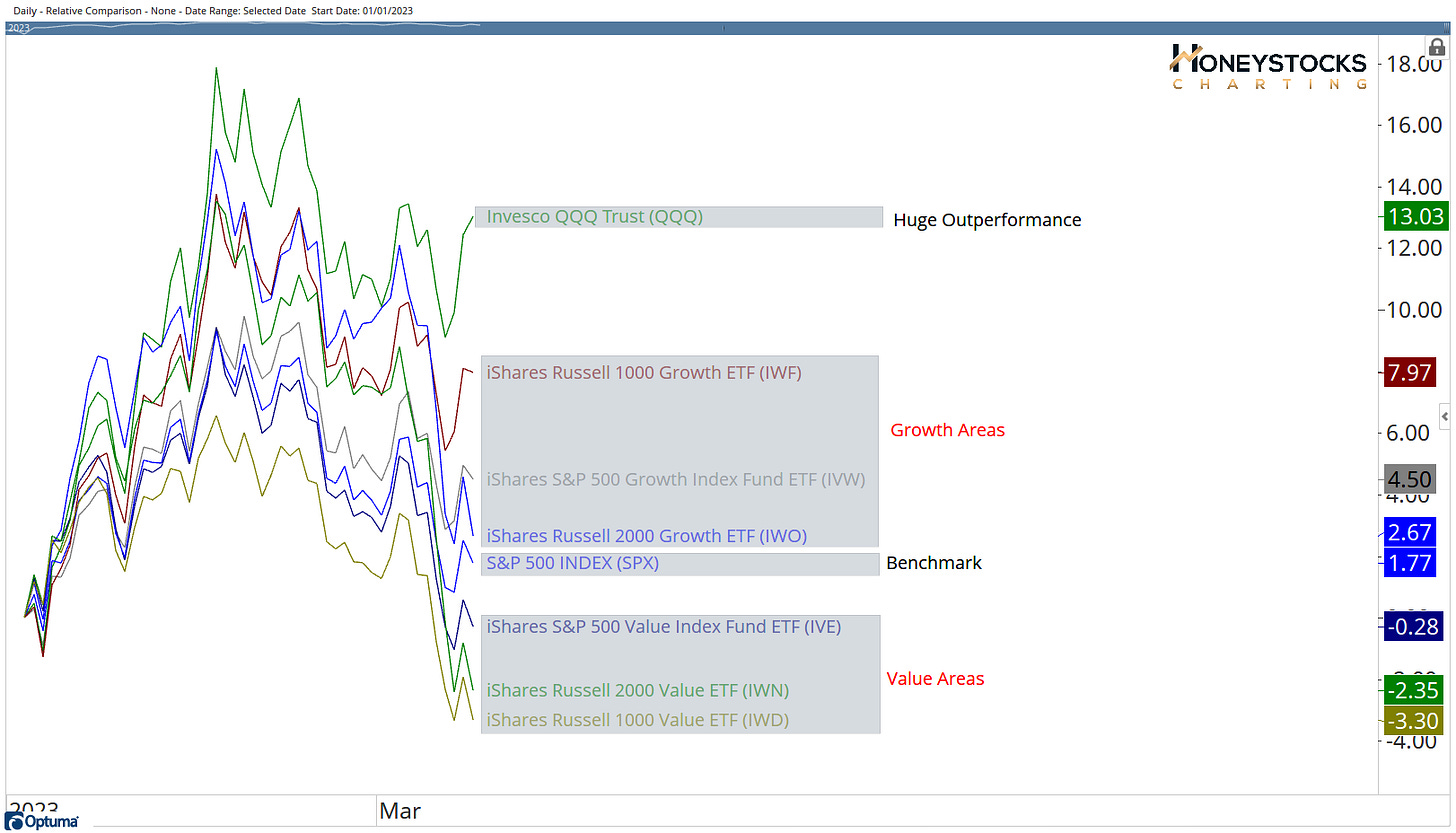
Growth is currently out performing Value but what’s REALLY standing out just now is the performance of the QQQ’s with +13% YTD.
Hidden within that performance data however, is the see-saw back and forth nature of a volatile market over the last few weeks.
Volatility
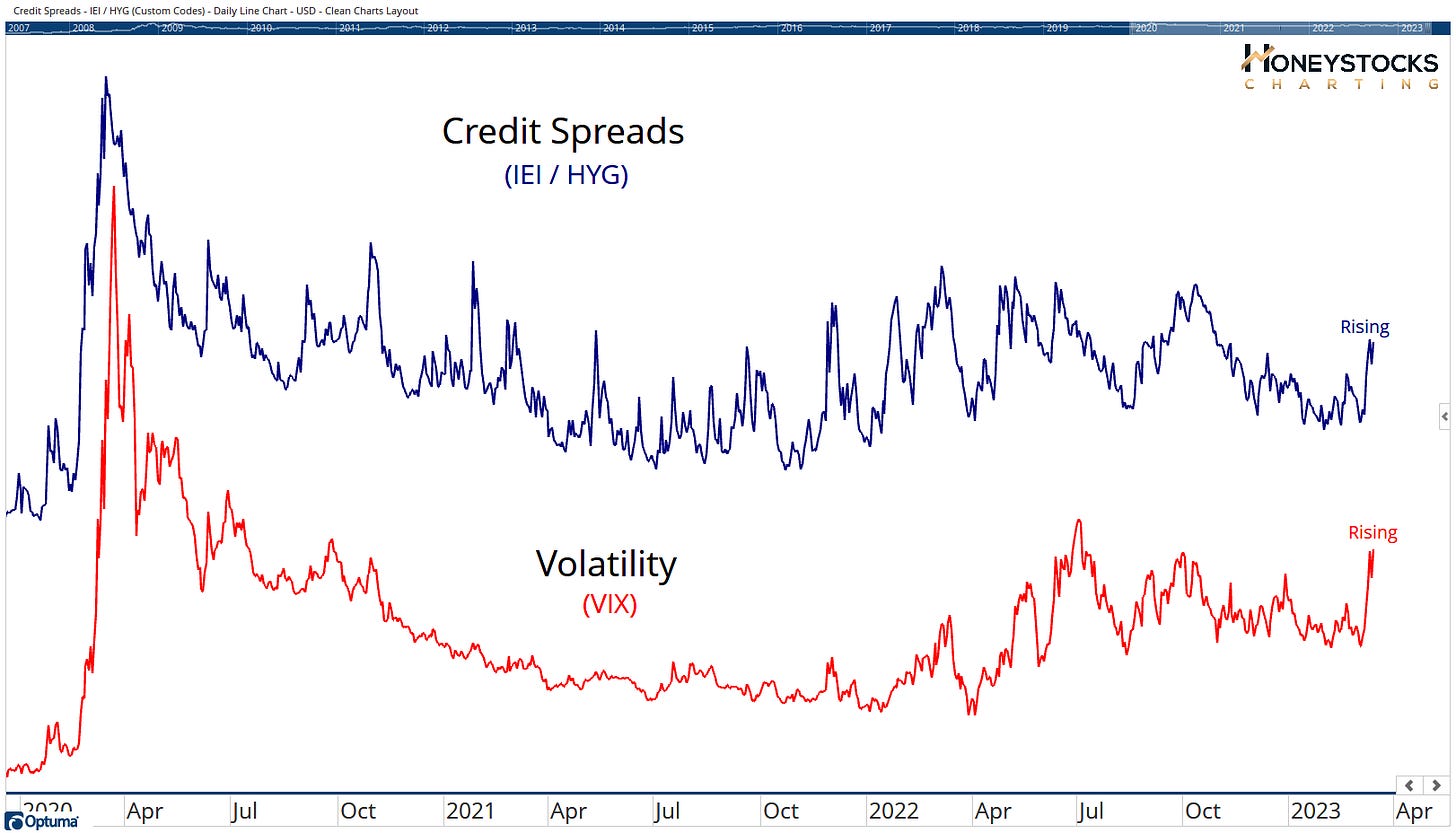
Volatility is spiking and with the bond market volatility spiking HARD.
The big question most us professionals have, is what’s going to happen to the VIX?
How high will it go?
I of course don’t have a definitive answer to that, but what I do know is there are charts doing just fine, and there are charts in distress.
There are some levels I’ll be watching for some market stability so let’s take a quick look at a couple of charts.
NYSE Composite (NYA)
NYA is 10.5% off its recent highs and I think we’re probably going to test that 14,000 level.
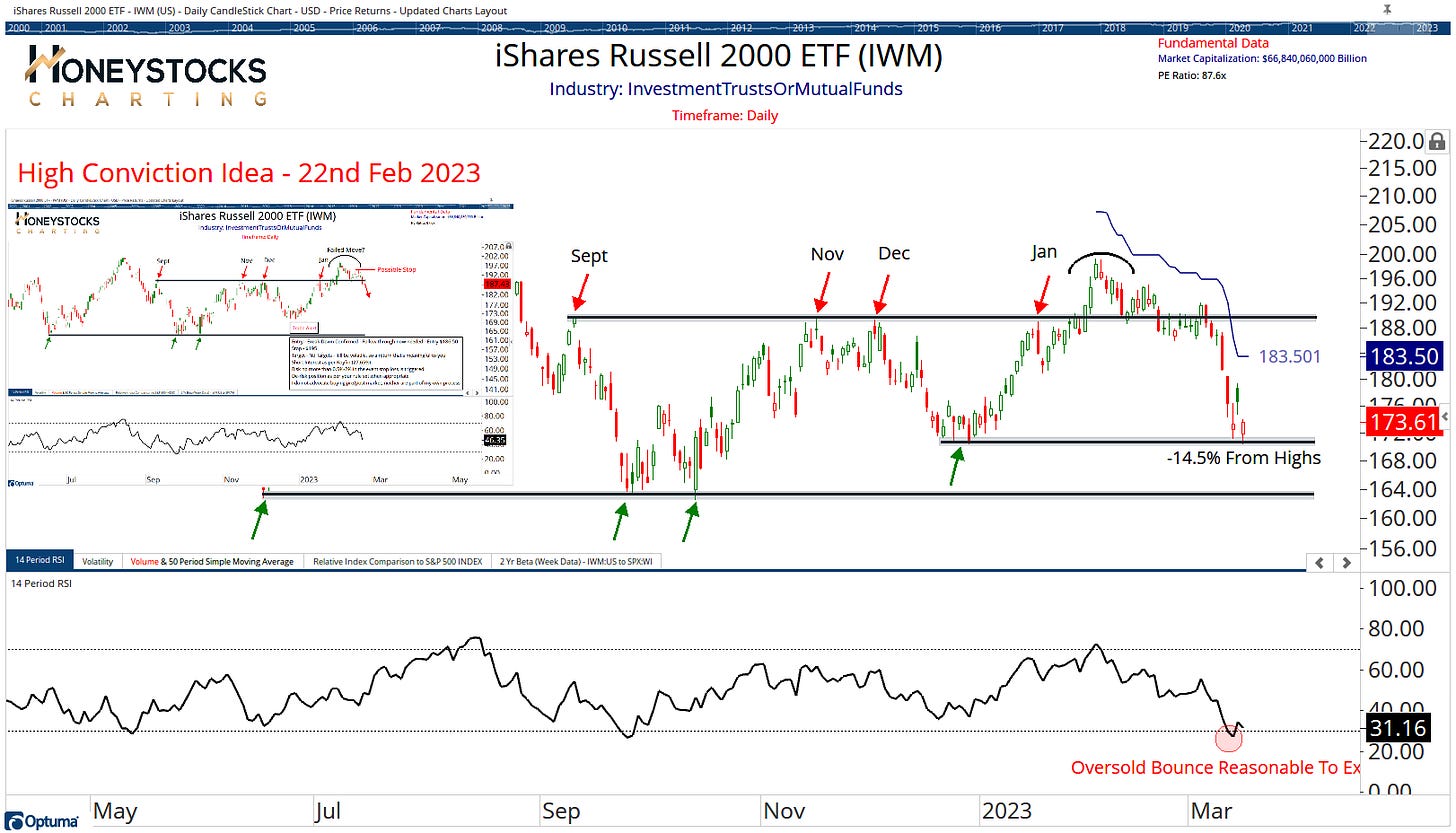
Russell 2000 (IWM)
The Russell 2000 is 14.5% off its recent highs and the hope is we can get some kind of meaningful rebound soon.
I mentioned above that there are plenty of stocks doing just fine so lets take a look at a few charts.
Meta Platforms (META)
META has been ripping higher for months now, must be something to do with $40B stock buy backs and TikTok bans… is it setting up for another break out?
NVDIA Corp (NVDA)
NVDA is an interesting 1, it’s another 1 of those mega cap tech names doing incredibly well and there hasn’t been a reason to sell… I do have 1 eye on the bearish RSI divergence, but I hope to see that corrected on a further break out.
In Conclusion
It’s still incredibly challenging just now. Batting singles is perfectly acceptable. Aggressively long OR short is just opening up a world of hurt.
If the market levels highlighted above break, there will likely be a tsunami of selling pressure, and if Big Tech has a sell off, probably the same thing so I’m staying open minded.
The chop likely isn’t going to change in the next 5mins but there are constructive looking charts out there (both bullish AND bearish) in areas all across the world.
The market’s simply doing what the market’s always done because investing behaviour hasn’t changed much over the last 100 years.
You just need to dig deep and put the hard yards in to identify the best charts.
Please do consider Subscribing and Sharing with like-minded folks. It’s free.
Alternatively, feel free to check out all our Premium Membership Options below.


