If you picked up last weeks letter where I covered the defensive posturing in Financials, Healthcare, Energy, Retail and the Equal Weight S&P500, hopefully you managed to sidestep a lot of last weeks carnage and hopefully the trade idea for SARK was also useful as a hedge.
In this weeks letter I’m going to get into the possibility of a tradeable bottom and share with you some of the charts and data provided to our clients / members at the weekend.
But lets start with this damn correction and whether it’s over or not.
Drawdown Numbers
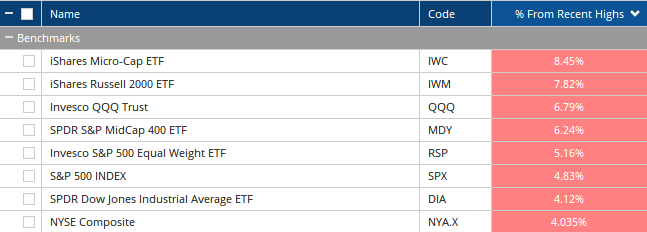
The declines in the major indexes (Monday’s price action is included here) tells the story of a text book, annual corrective phase for the market with the riskiest stocks declining 9-9.5% and the mega cap juggernauts of the Q’s declining approximately 8%.
Whether you want to use the old 10% equals a correction nonsense or not, the numbers, the charts and the performance of many stocks, certainly feels like a correction, and just like every other correction that’s come before it, there’s another abundance of opportunity.
NYSE Composite (NYA)
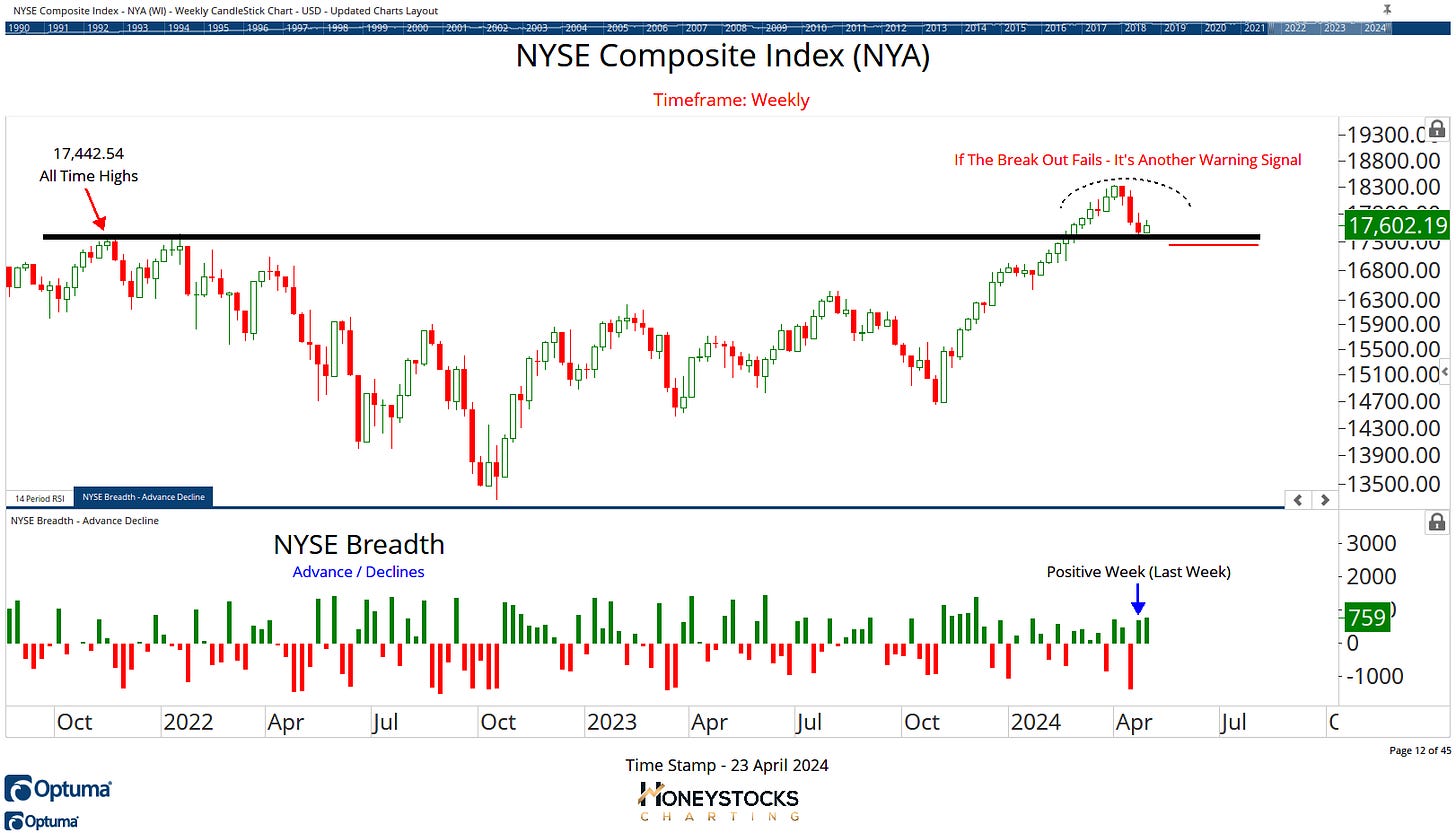
One of the charts shared with our clients at the weekend was the NYSE Composite chart with the accompanying breadth data.
Despite last weeks carnage in all the major indexes, the number of stocks advancing outnumbered the stocks declining and while I take breadth data (generally) with a pinch of salt, I also like to take the time to look under the surface during corrections because it can oftentimes provide the signal needed to start buying stocks again.
Invesco QQQ Trust (QQQ)
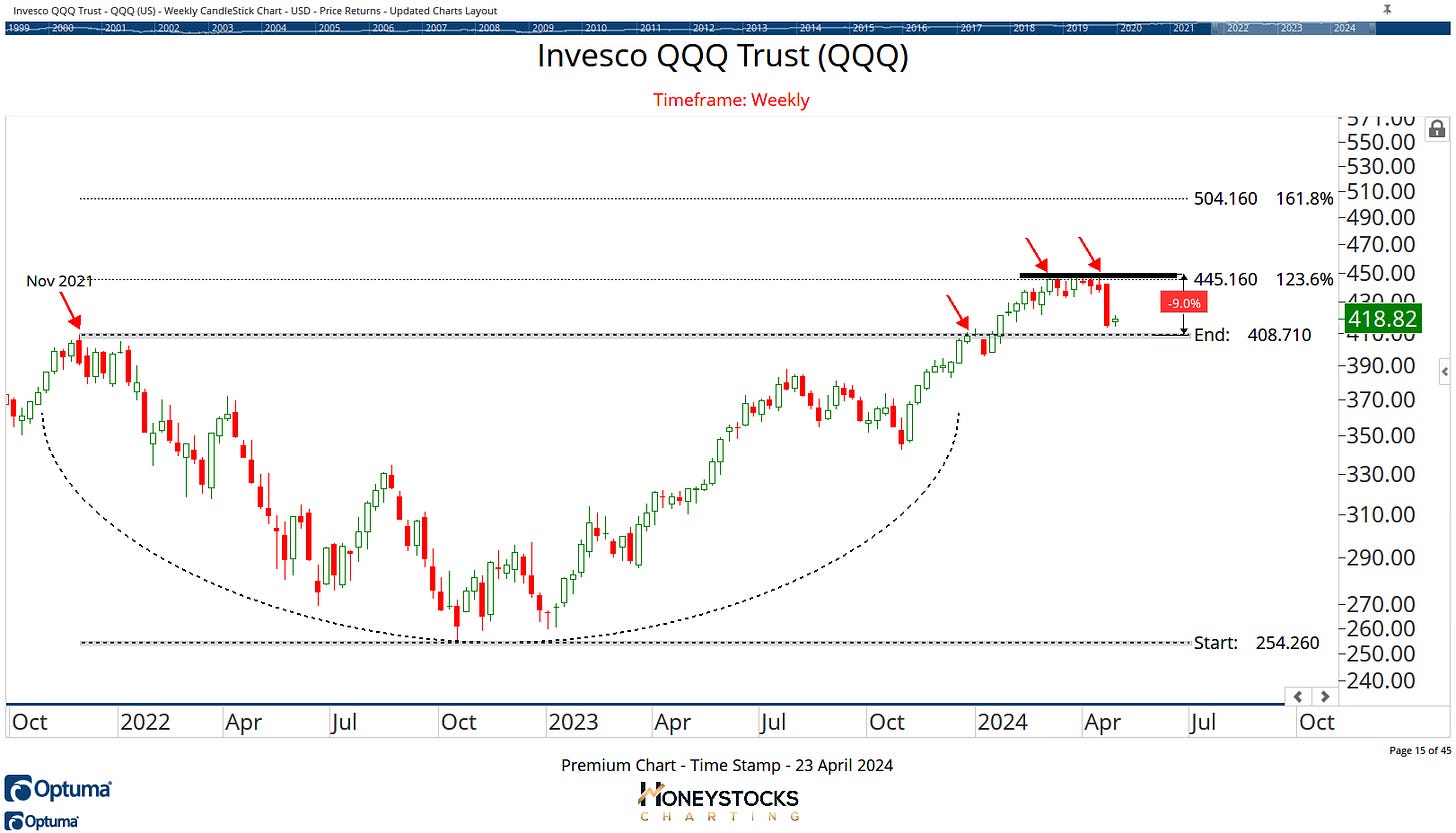
Last week, I was watching and waiting for a possible break out / rotation into technology stocks after the recent chop, and with the pull back over the last week, we now have perfectly logical price levels to manage risk against with those 2021 Highs the line in the sand.
Credit Spreads / VIX
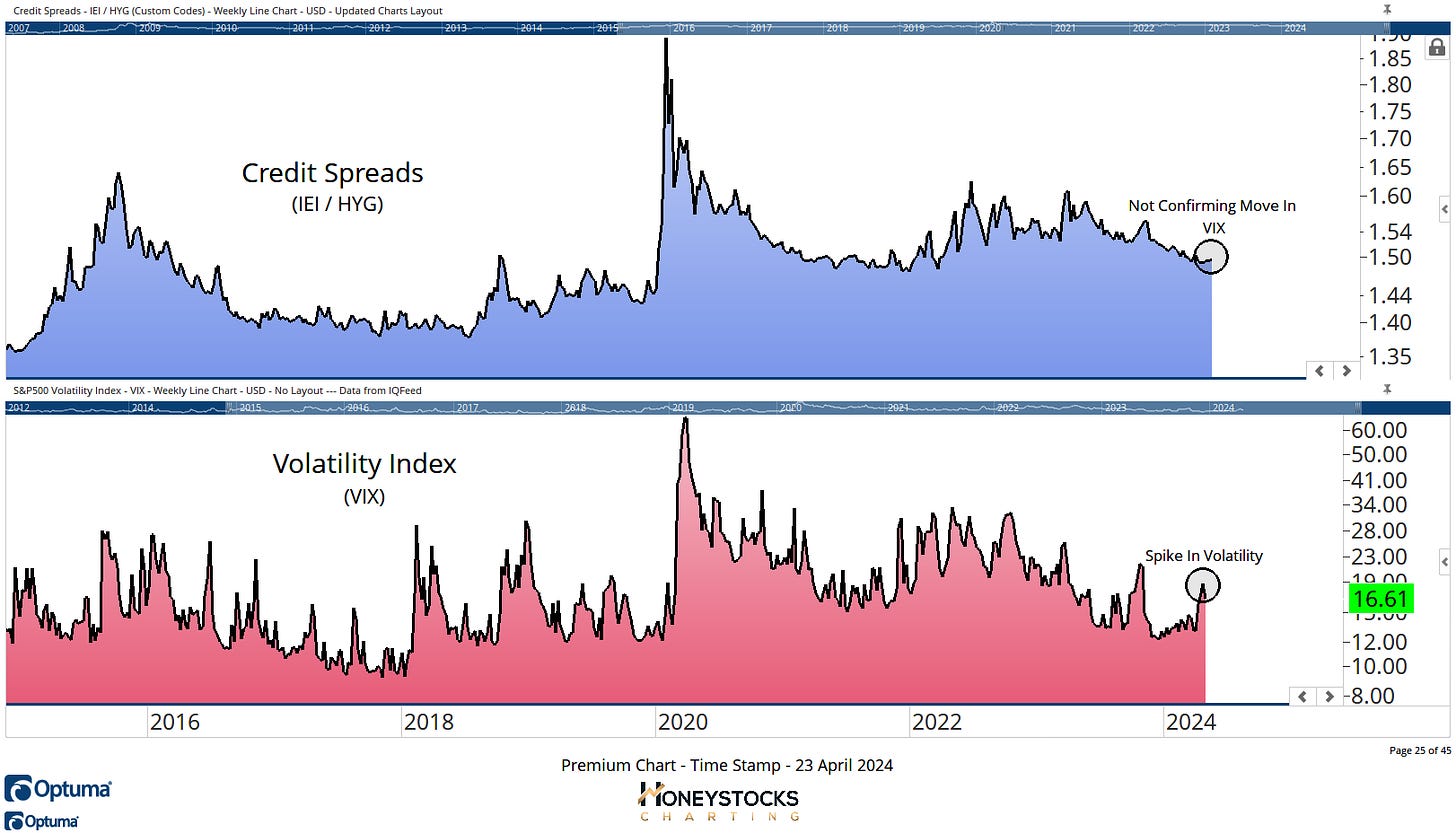
Another data point is the VIX spike NOT (yet) being confirmed by a meaningful move in credit spreads so it’s another chart that probably points to a perfectly normal, healthy, text book pull back, rather than the Armageddon scenario most of the wall street doom monger would have you believe.
But lets not get it twisted, the charts, at the index level have had a lot of technical damage, they’re now a mess.
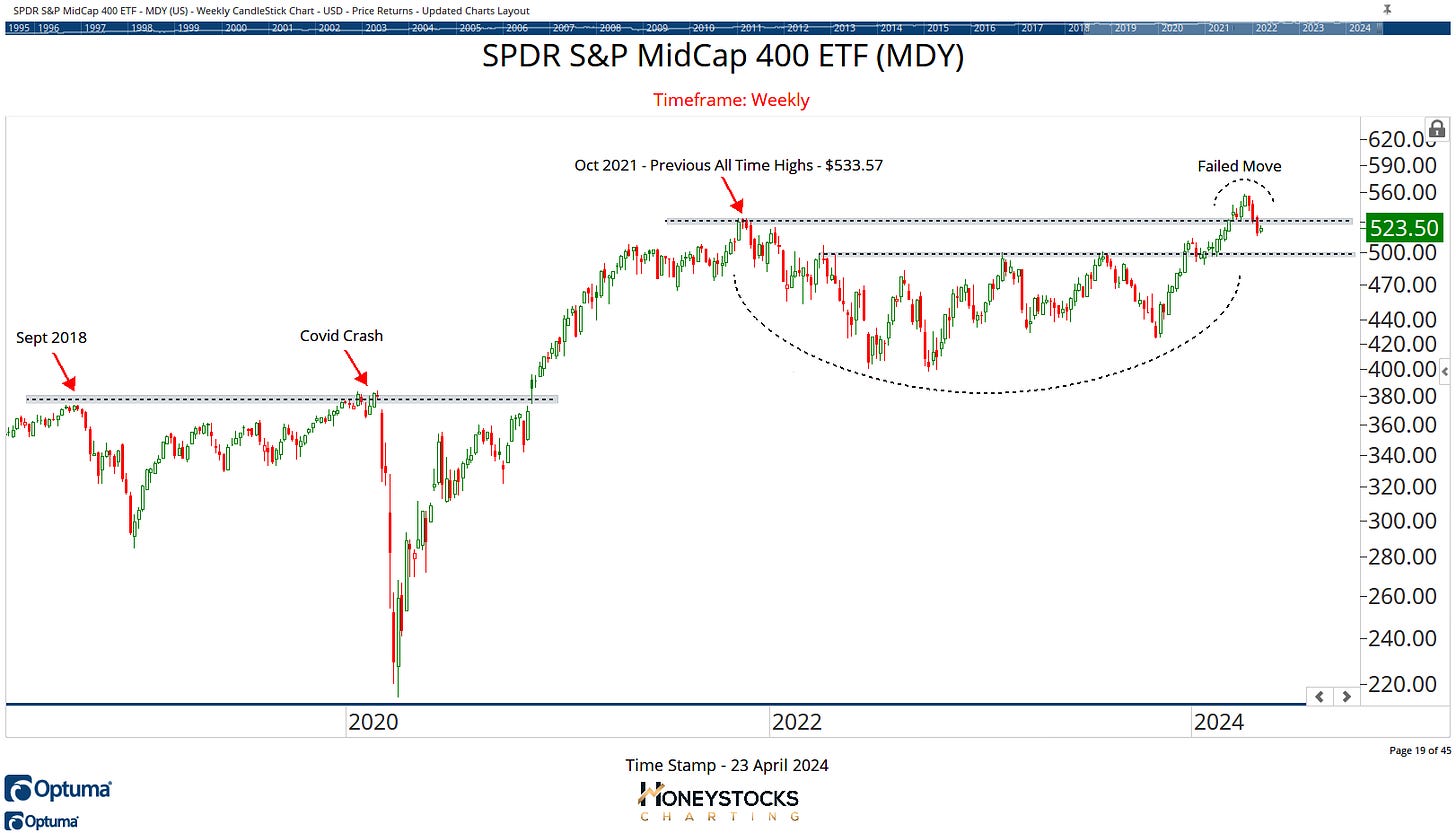
SPDR S&P Midcaps (MDY)
Look at the chart for midcaps, it’s not exactly a chart that screams “buy me” is it, and this is an example of what I mean by technical damage and if we’re looking objectively, the chart looks like it might just be getting warmed up to go lower.
But given the declines across the market, you just HAVE to look for buying opportunity.
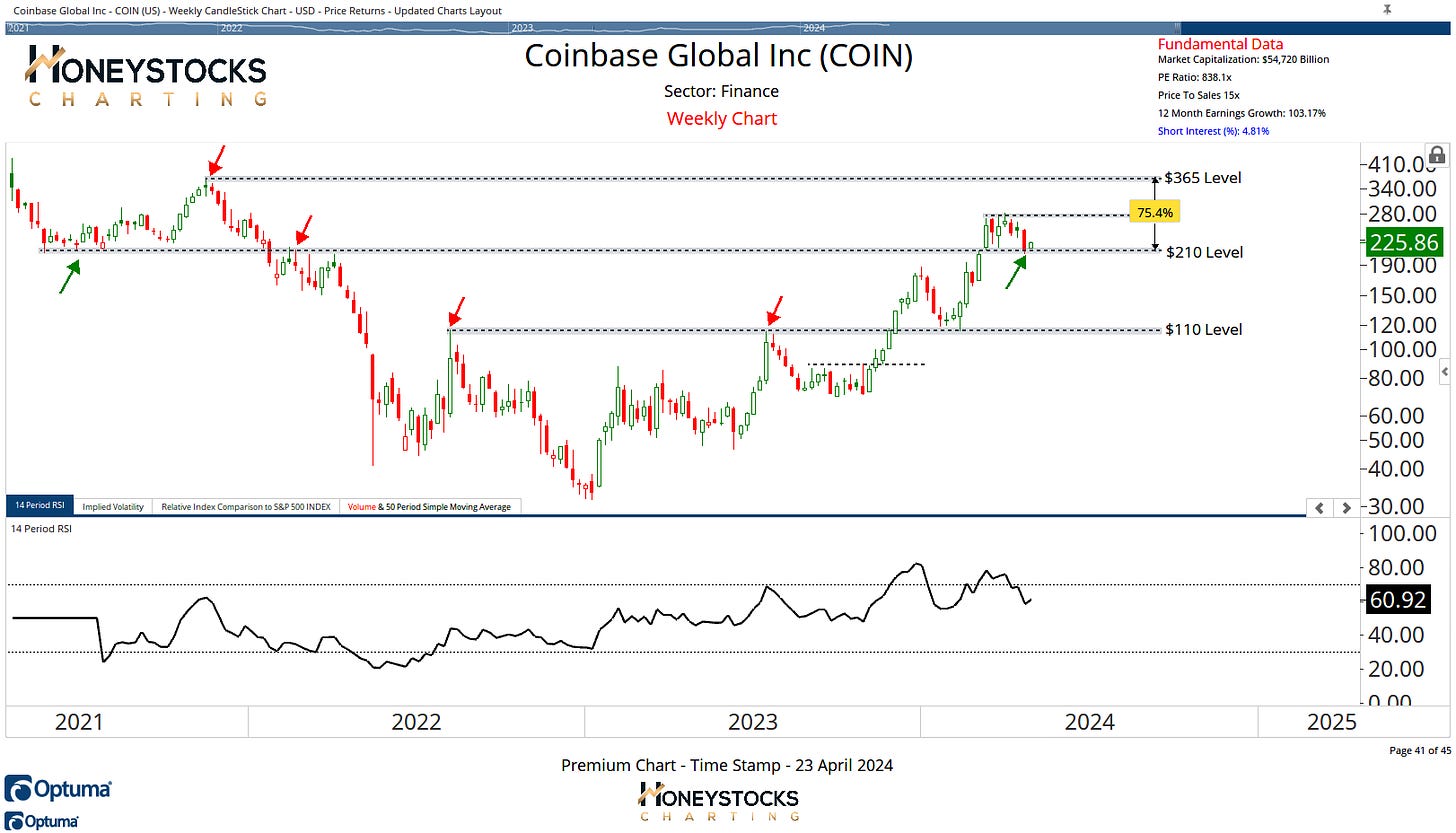
For me, it’s crazy not to and Coinbase was 1 of our buy low : sell high charts provided at the weekend to our members with the Bitcoin “halving” in mind and it kicked off the week with a +7% move yesterday.
The $210 level is being used for risk management purposes.
Coinbase (COIN)
Advanced Micro Devices (AMD)
I’m also building in potential levels of price support for the biggest hitters and if we’re not considering good / solid stocks on 30-40% drawdowns then what are we even doing?
It’s a good example of my premium work just now.
In Summary
Like I said to our members at the weekend, it’s really tricky just now with lots of tricky charts.
If we sat and had a beer, I'd tell you the NYSE Composite is the key to everything (for me) right now.
I’m using this chart as a possible tradeable bottom signal with the explicit understanding that if it collapses below the highlighted levels on the back of tech earnings over the next 2 weeks and the Q’s give up those prior highs, we’re looking at a far more severe correction than the one we’re currently dealing with.
My conviction in market direction is truly 50/50 just now but that doesn’t mean you can’t nibble or bat singles.
If the NYSE Composite rebounds, you’ll at least be in on the ground floor of the recovery, that’s how I view it.
Have a great week and hopefully next week we’re a bit higher than we are today.
ACCESS OUR PREMIUM WORK


