Stay tuned, I’ll be communicating some exciting news in the next couple of weeks
Everyone’s excited aren’t they?
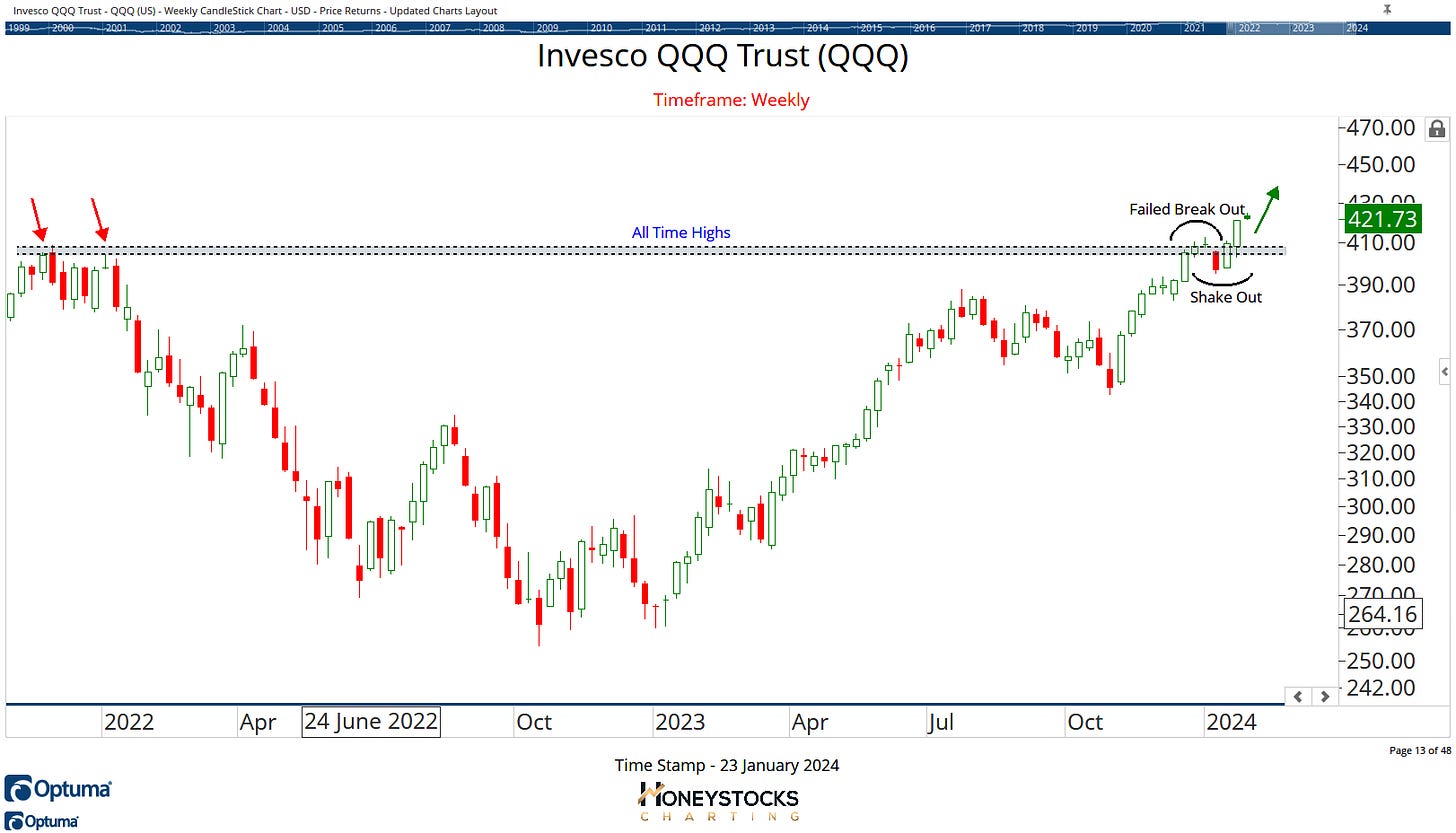
New all time highs for the S&P500, the Q’s and the Dow, so it’s difficult not to be excited, right?
Or are you (like many folks I know) in the camp of being fearful of pulling the trigger and buying stocks at all time highs, because you’ve missed an epic rally the last 15 months and you keep hearing the word recession?
Despite the narrative some folks are selling just now, the year hasn’t started out too great under the surface.
If you follow my X/Twitter closely, you’ll know that over the weekend I put a bit of a check on someone who many consider to be the worlds best technical analyst and someone I’ve learned a lot from.
I’m not buying what they’re selling just now, we’re allowed to see it differently and in this weeks letter I’ll get into some of the charts I think are worth keeping a close eye on over the coming weeks.
But lets start with the narrative stocks have started the year great and everything’s hunky dory.
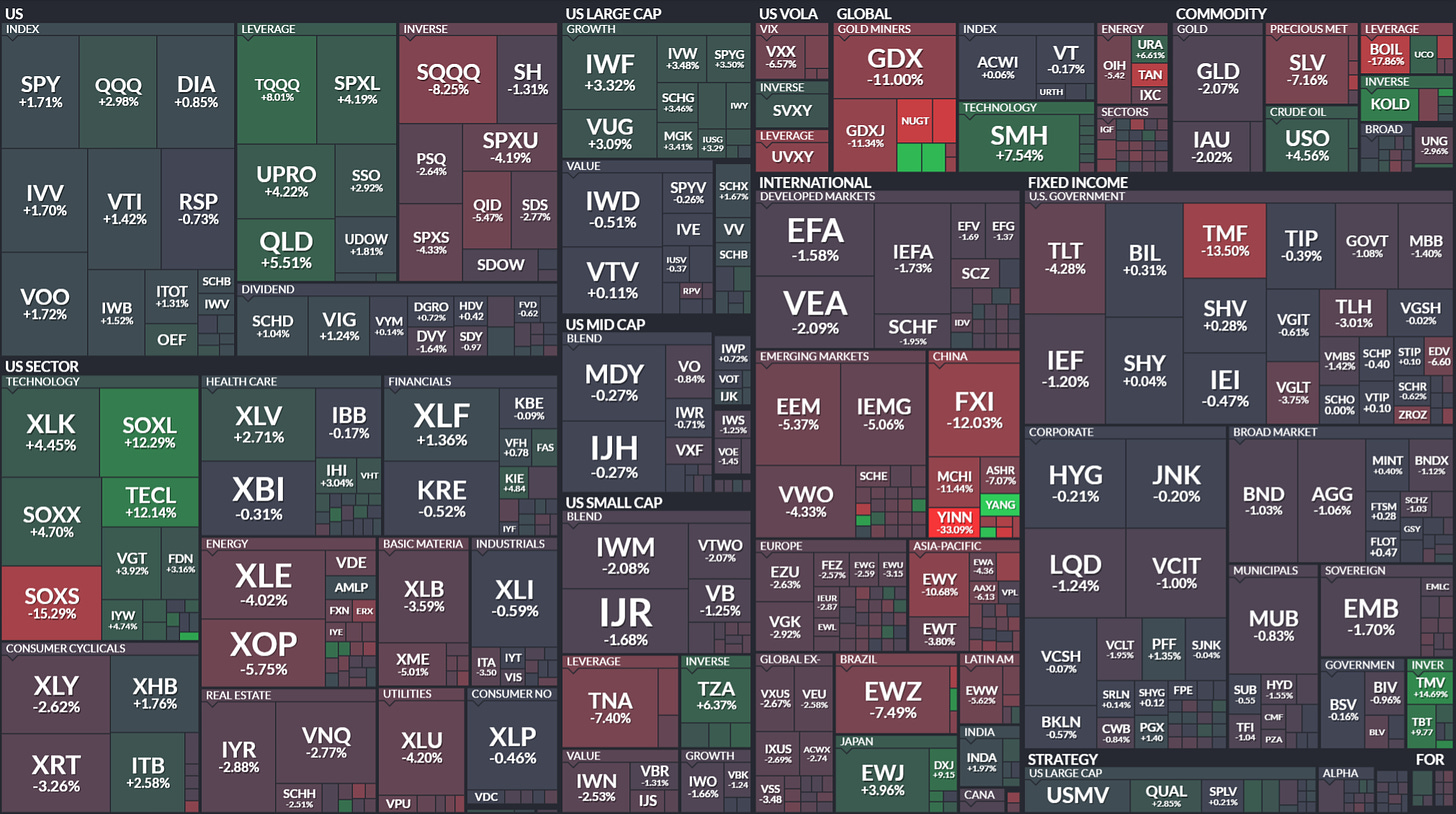
Year To Date ETF Map
What we’re seeing (so far) in the 1st month of the year is exactly the same as last year, we’re seeing mega cap tech names mask a lot of the under the surface damage that’s taking place.
If you want to cherry pick data and look forward from 6/12/18 months ago, sure, breadth expansion - check, small cap performance - check, you can present the data any way you want.
Obviously this is just a sample of ETF’s, I monitor many more but if you go and look at the January numbers and go chart by chart like I do, it doesn’t make fantastic reading.
But lets take a quick glance at the major indexes because there’s some conflicting information in a variety of charts I think are worth paying attention to.
S&P500 ETF (SPY)
Invesco QQQ ETF (QQQ)
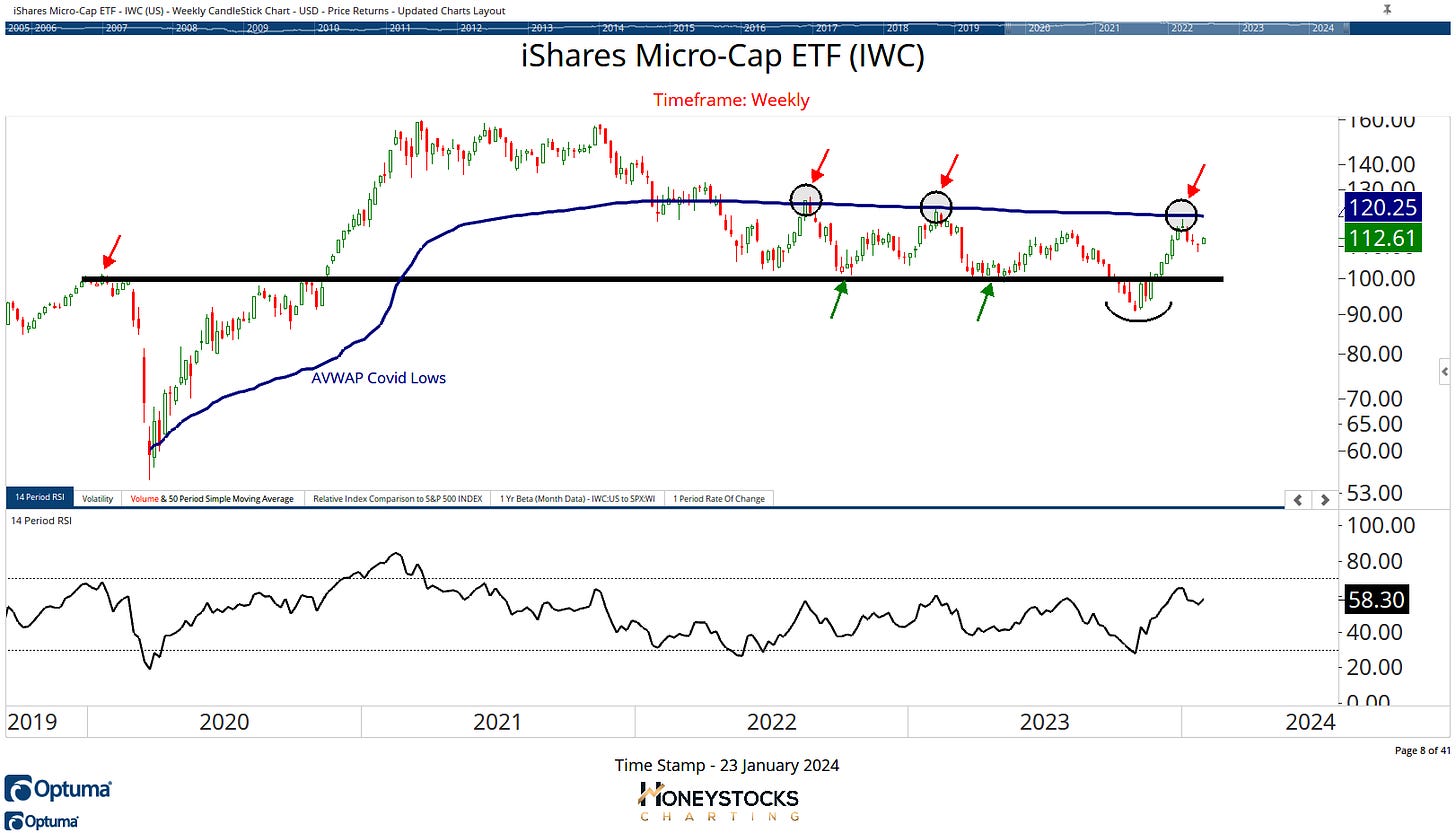
iShares Micro Cap ETF (IWC)
Before I get into the next few charts, let me be clear.
As I type this letter out on Tuesday morning before the market open, the market is bullish, it’s very very bullish… if indexes are going out at all time highs, and you’re betting against the market, I’d suggest over time, it’s going to be a mostly losing endeavour, it’s just easier to identify and moving with uptrends, that’s my 2 cents.
Debate me in the comments on that if you like.
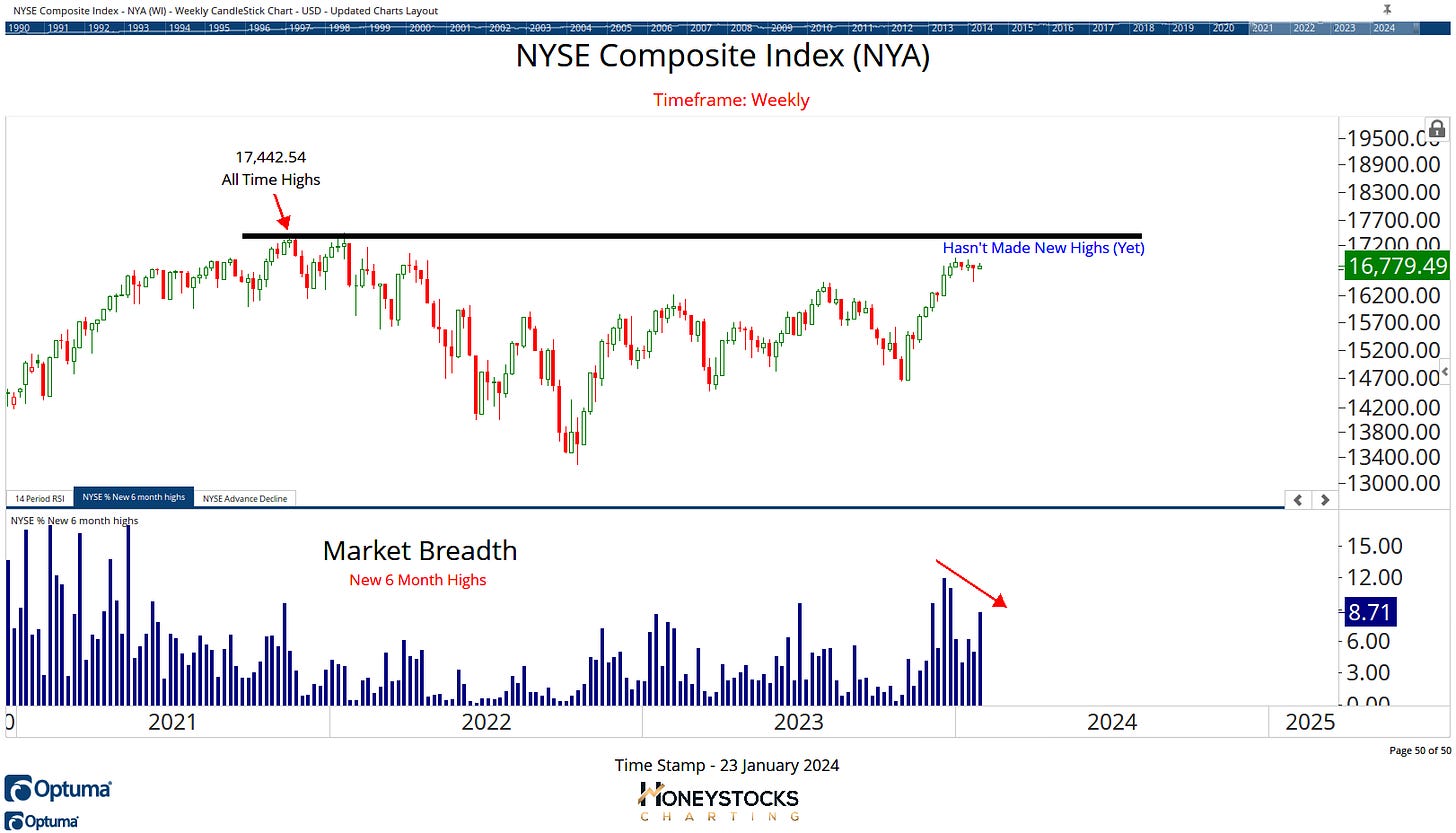
NYSE Composite (NYA)
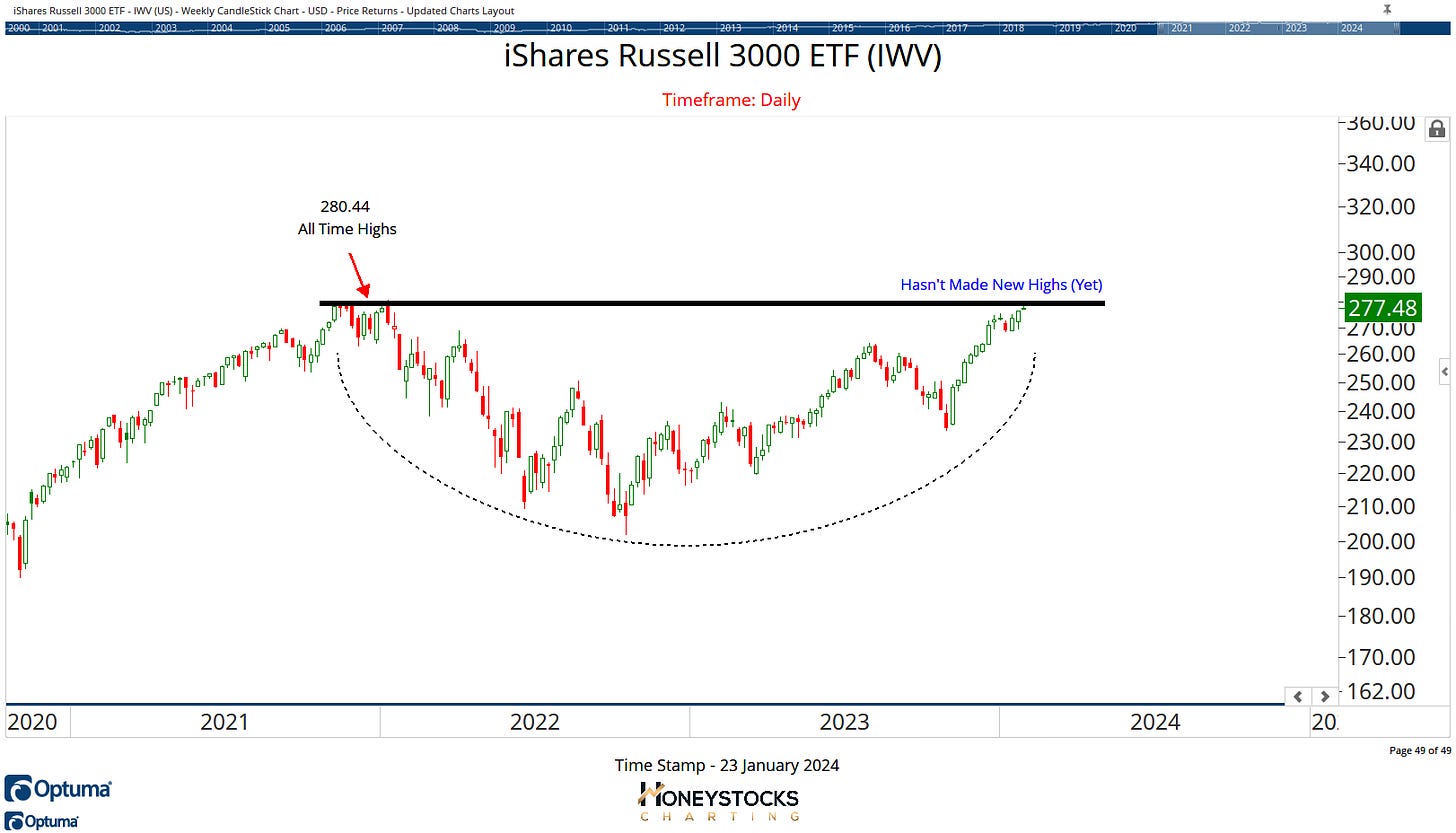
Russell 3000 (IWV)
Meanwhile, the Russell 3000 and NYSE Composite have still to make those new highs and while they could blast off to new highs before month end and follow the S&P and Q’s, in the meantime, are we supposed to trust the smaller indexes or the larger indexes?
I don’t know either.
So here’s my hot take for you.
I couldn’t care less and I couldn’t give 2 shits what the indexes are doing because for me, it’s a market of stocks and taking the time to run through thousands of charts every week to find the best ones.
Here’s a few of our premium charts that I’m talking about.
Netflix Inc (NFLX)
With earnings due this evening, I’d NEVER advocate gambling on an earnings outcome, but the chart is now delicately poised and might get interesting in the coming days provided it doesn’t collapse into a heap on its ER numbers.
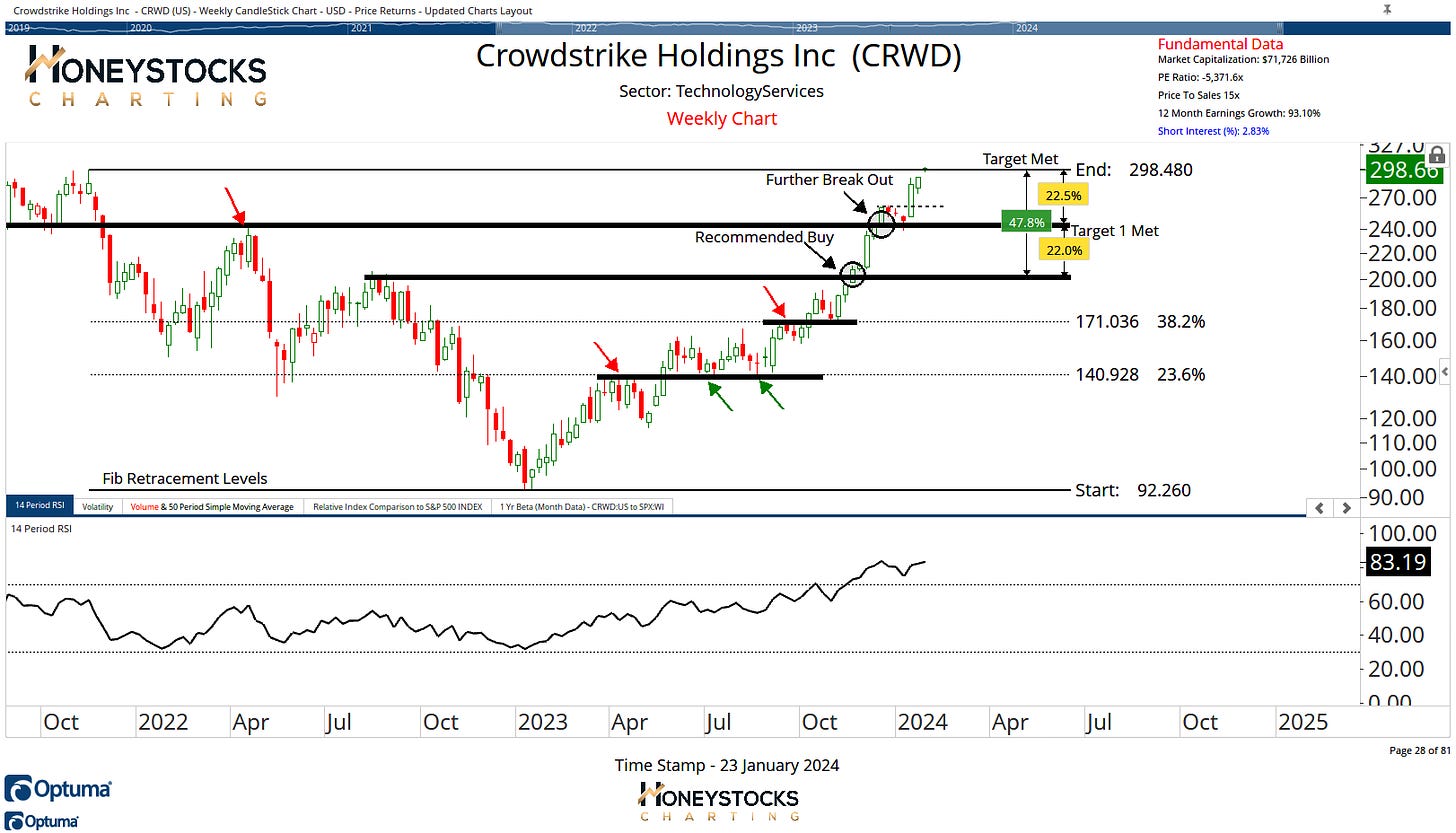
Crowdstrike Holdings (CRWD)
We actually just met our upside targets in Crowdstrike yesterday, it’s been 1 of the charts we’ve been covering a few months now.
The relative strength gurus are probably highlighting right about now, but for us, it needs to prove itself again and break out.
Cboe Global Markets Inc (CBOE)
Another of our premium charts I highlighted a few weeks ago already met our logical upside targets and it’s been basing / consolidating nicely ever since.
Is it breaking out again?
In Conclusion
I learned a long time ago that over-thinking the indexes can be a paralysing endeavour, and while small /micro caps have been a no go zone so far in 2024, if they start to play catch up again (like they did at the end of last year), we’ll start to see it in the individual stocks.
So I’ll continue to focus on ripping through the charts rather than overthink the indexes at current levels.
How do you see it?
The charts above are just a few of the 30 charts presented over the weekend in addition to the 100’s of stocks, ETF’s and Commodities we’re covering in our chart books for hundreds of our members.
I’d recommend checking that out below.


