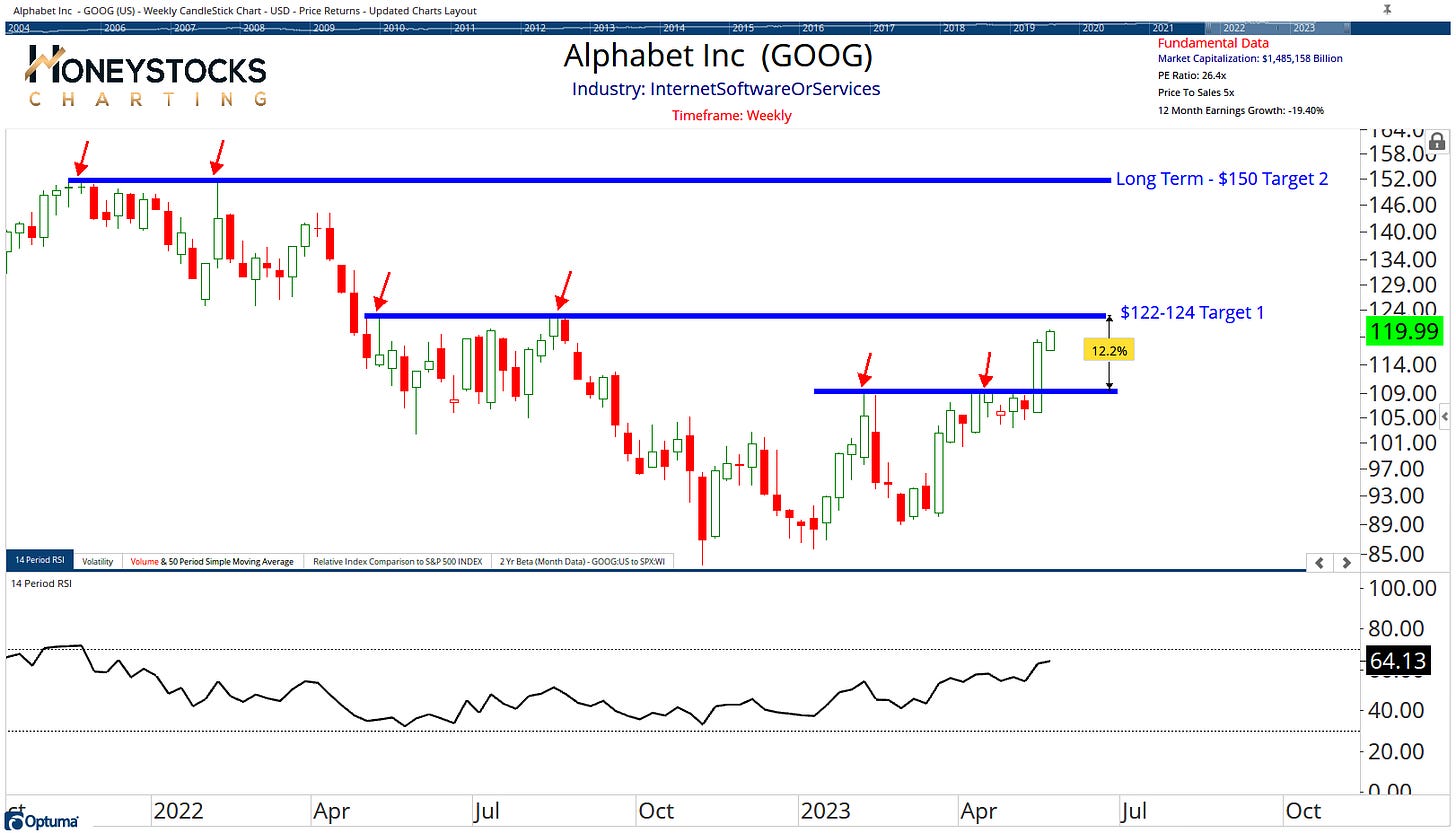
If you picked up last weeks letter and the Alphabet Inc (GOOG) chart, congrats, it’s been an incredibly fruitful week.
Target 1 is pretty much met. (updated chart below)
Alphabet Inc (GOOG)
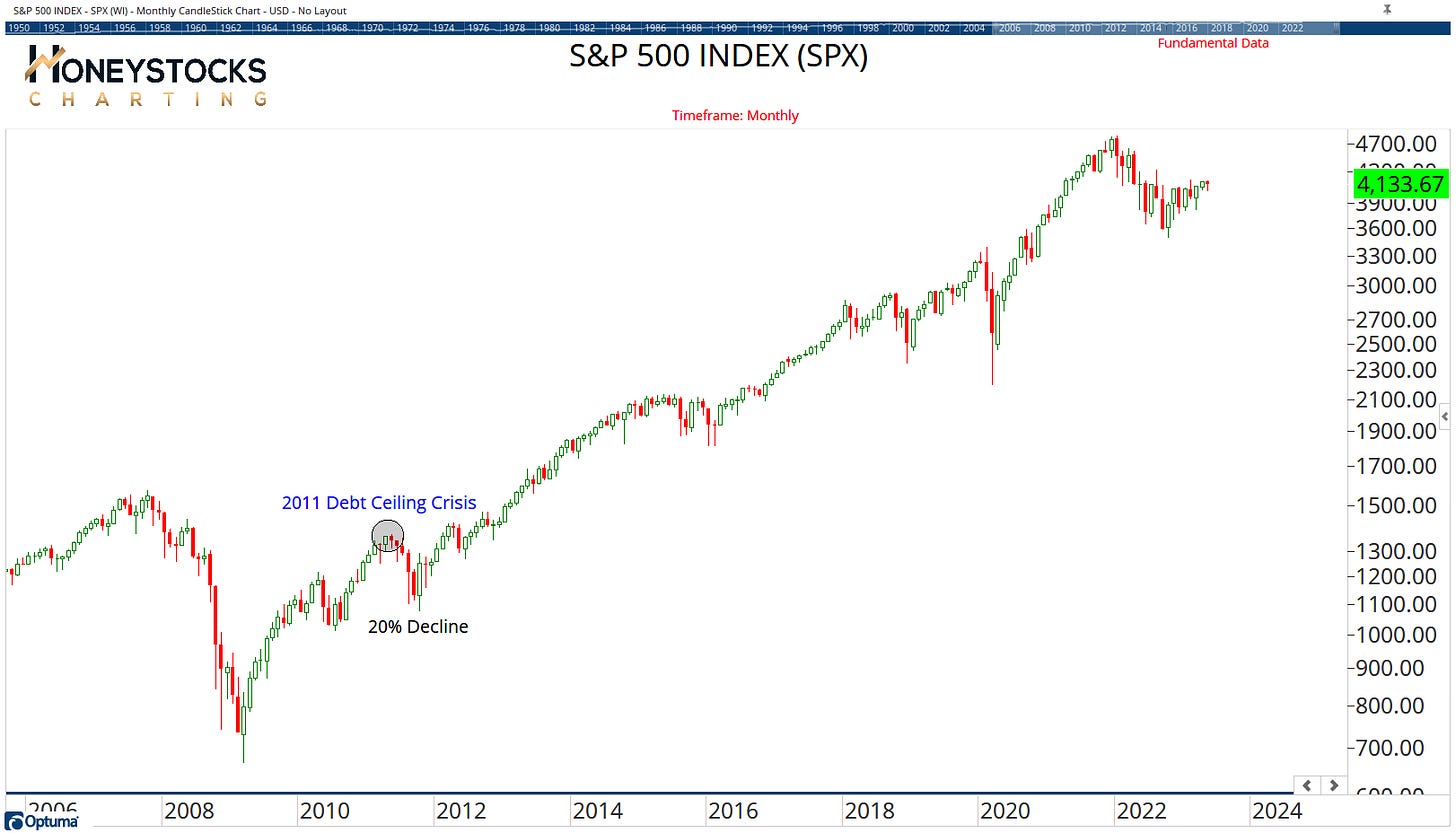
Before I dive into a few more charts in this weeks letter, we’re now seeing a lot of news headlines with words like “debt ceiling” and “global economic collapse”.
My work is of course incredibly technical so I’m not getting into conversations that are over my head, but I am acutely aware the last time we had a major problem with the debt ceiling back in 2011, the S&P dropped 20%. (chart below).
I’ll be keeping a very close eye on the data (price) as it comes in and an open mind, but please bare in mind, my thesis on EVERYTHING could change on 10secs notice.
If you’re comfortable with that, keep reading.
S&P500 - 2011 Declines
As you can probably guess by the Ex-Machina cover picture this week, my weekly letter is going to touch on the Artificial Intelligence space and some of the more interesting charts.
As well as some charts from my Country ETF Chart Book.
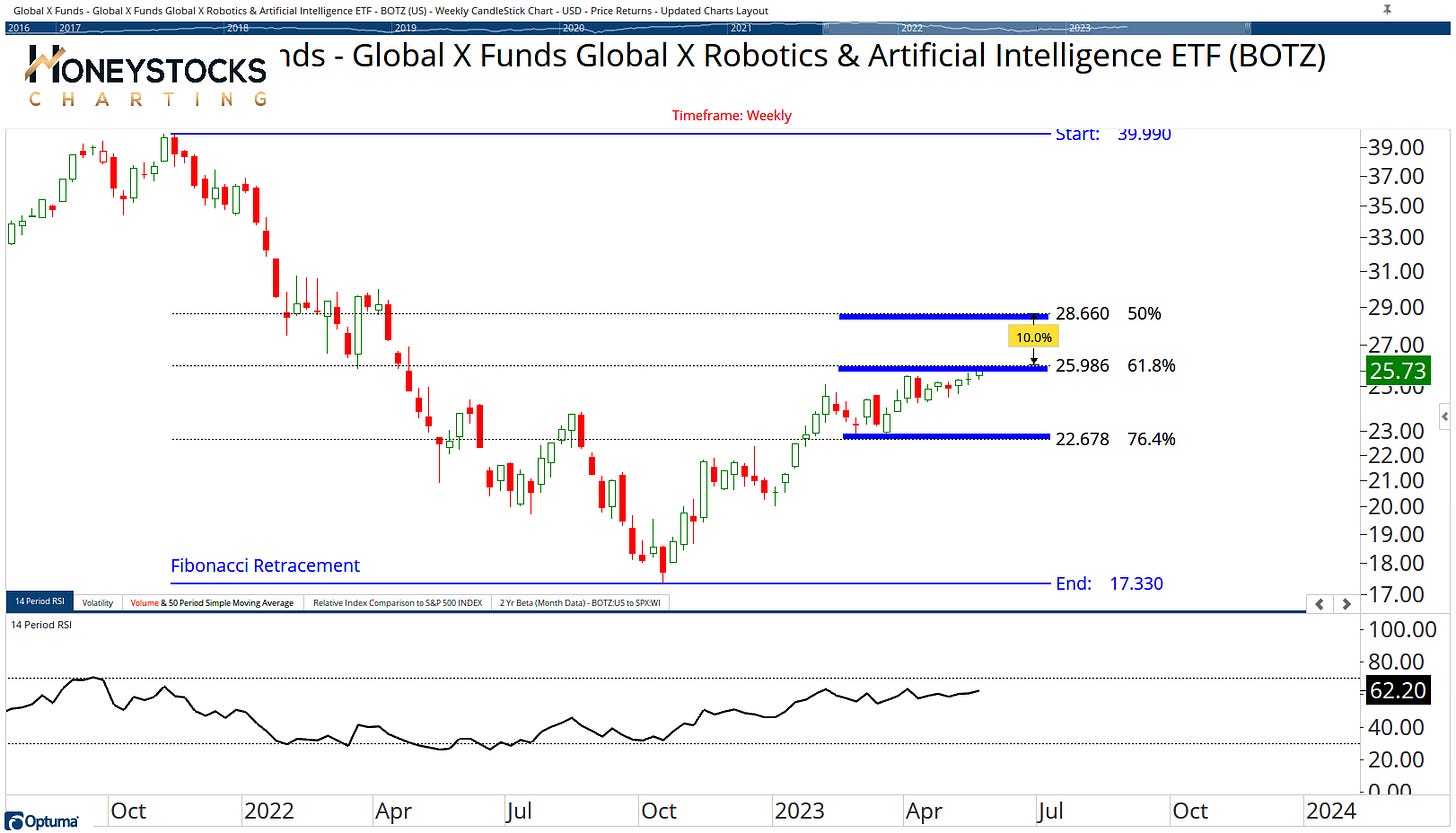
Robotics and Artificial Intelligence ETF (BOTZ)
The A.I sector (BOTZ) has been lead by the likes of NVDA over the last few months and is up a whopping 25% YTD with everyone’s favourite semiconductor company up a ridiculous 103% YTD.
If the BOTZ ETF claims the $26 level, the technical analysis text books bring in the 50% retracement level as a possible upside target.
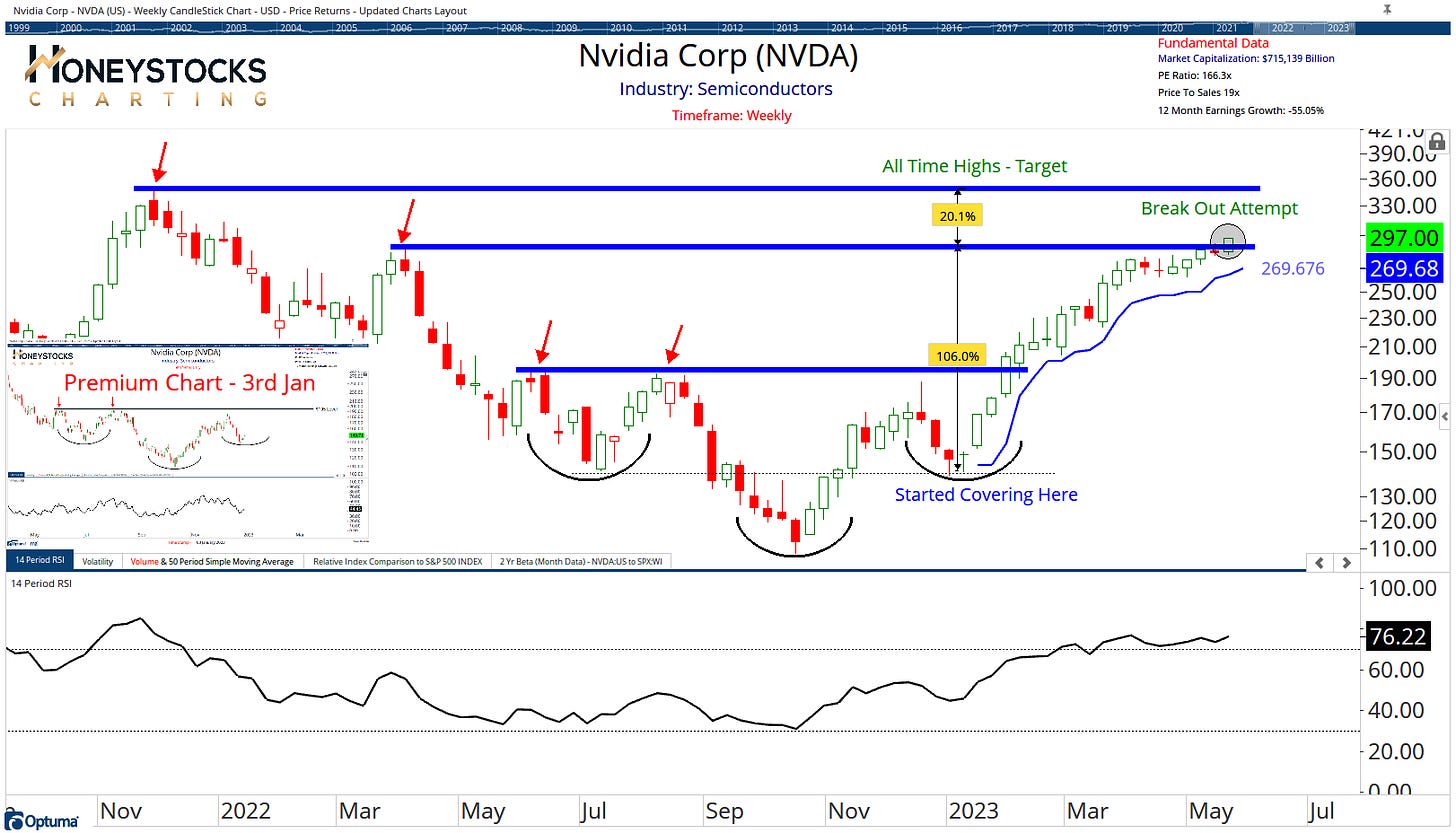
Nvidia Corp (NVDA)
If you follow my work closely, you’ll know already that our clients / members have been profiting VERY well from NVIDA this year (chart below), but is there still another 20% upside going into the final innings of its uptrend?
If the woke A.I Terminator apocalypse is slowly creeping upon us, the very least I can do is profit from it so that I can keep giving my dog it’s best life so I’m personally hoping to squeeze another 20% move on multiple positions.
Lets see how far NVDA ultimately goes.
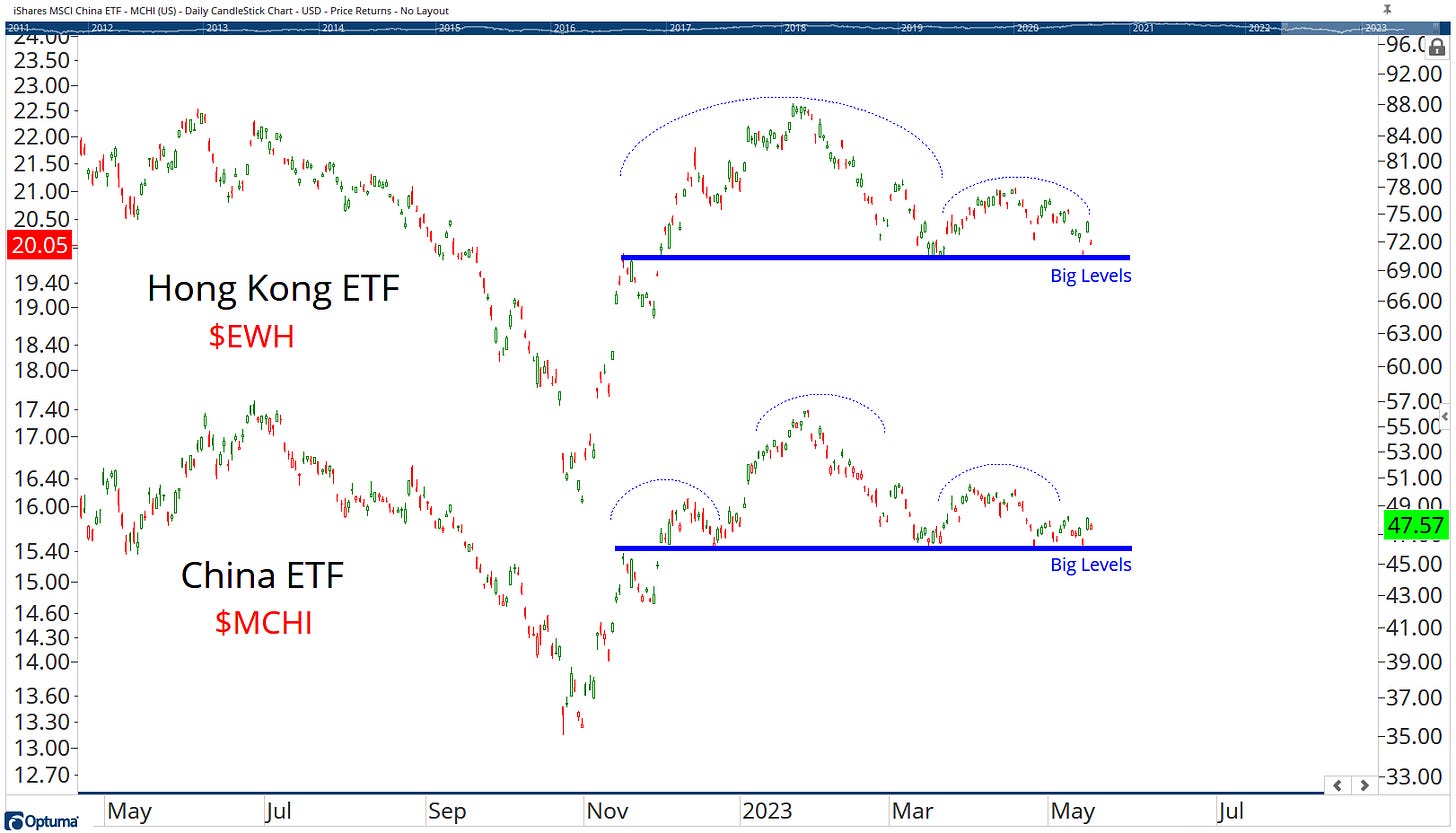
China (MCHI & EWH)
I had a few questions on my China chart from Twitter last week, so let me quickly touch on it.
For me, the charts are showing the characteristics and investor behaviour that I typically see in advance of declines.
That said, price always needs to confirm the pattern, so until price crosses the blue lines, there will be areas of China continuing to do well and they’re still fair game (JD has recently been great for us).
But, if price crosses those blue lines, risk management is probably coming into play for Chinese stocks and I like to prepare for these things in advance rather than “react”.
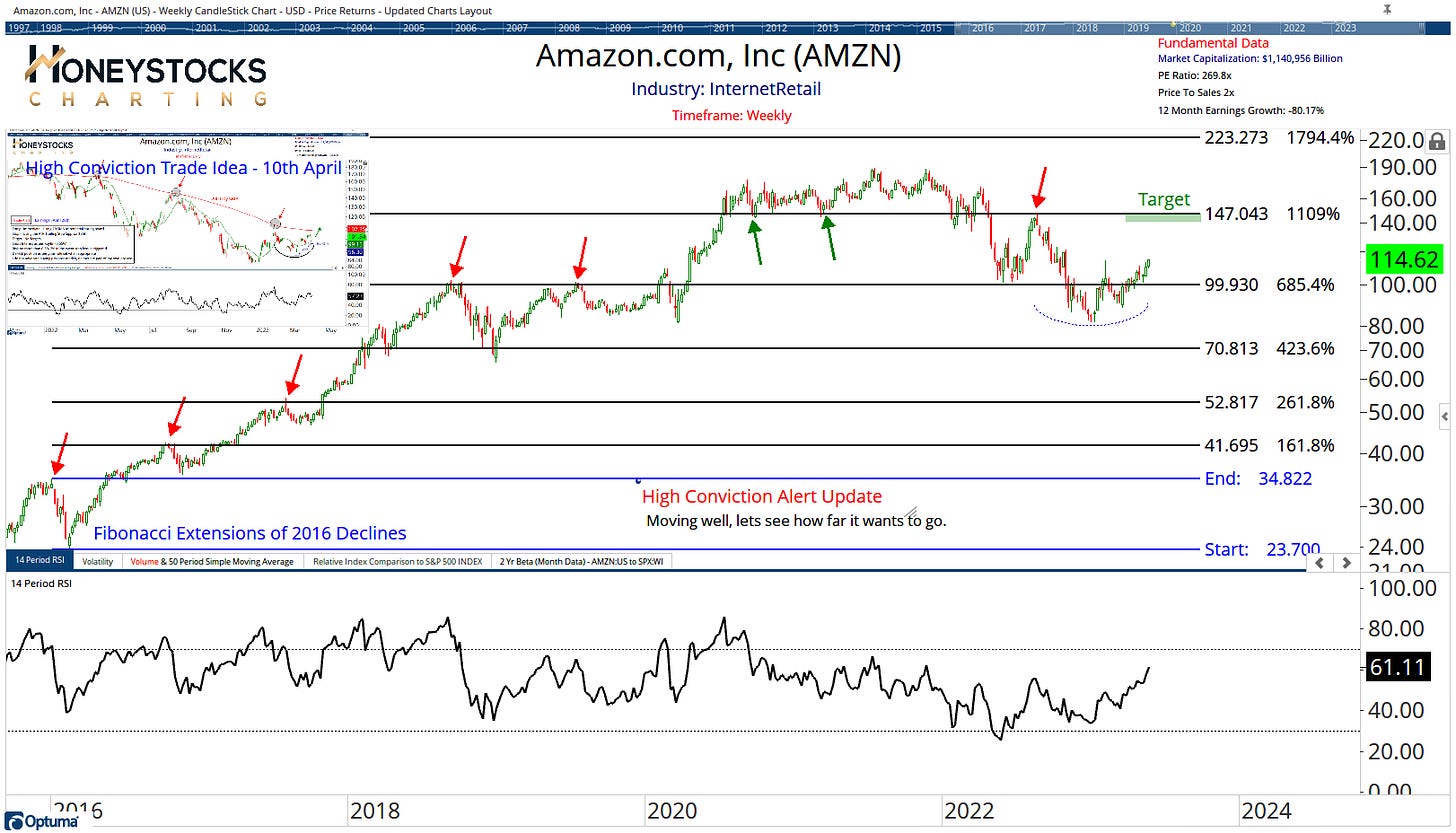
Amazon (AMZN) - Recent Trade Alert
Amazon continues to excel after putting a bottom setup last month at $100 and we’re now working with upside objectives up around $147. (Obviously market dependant).
It’s been really terrific.
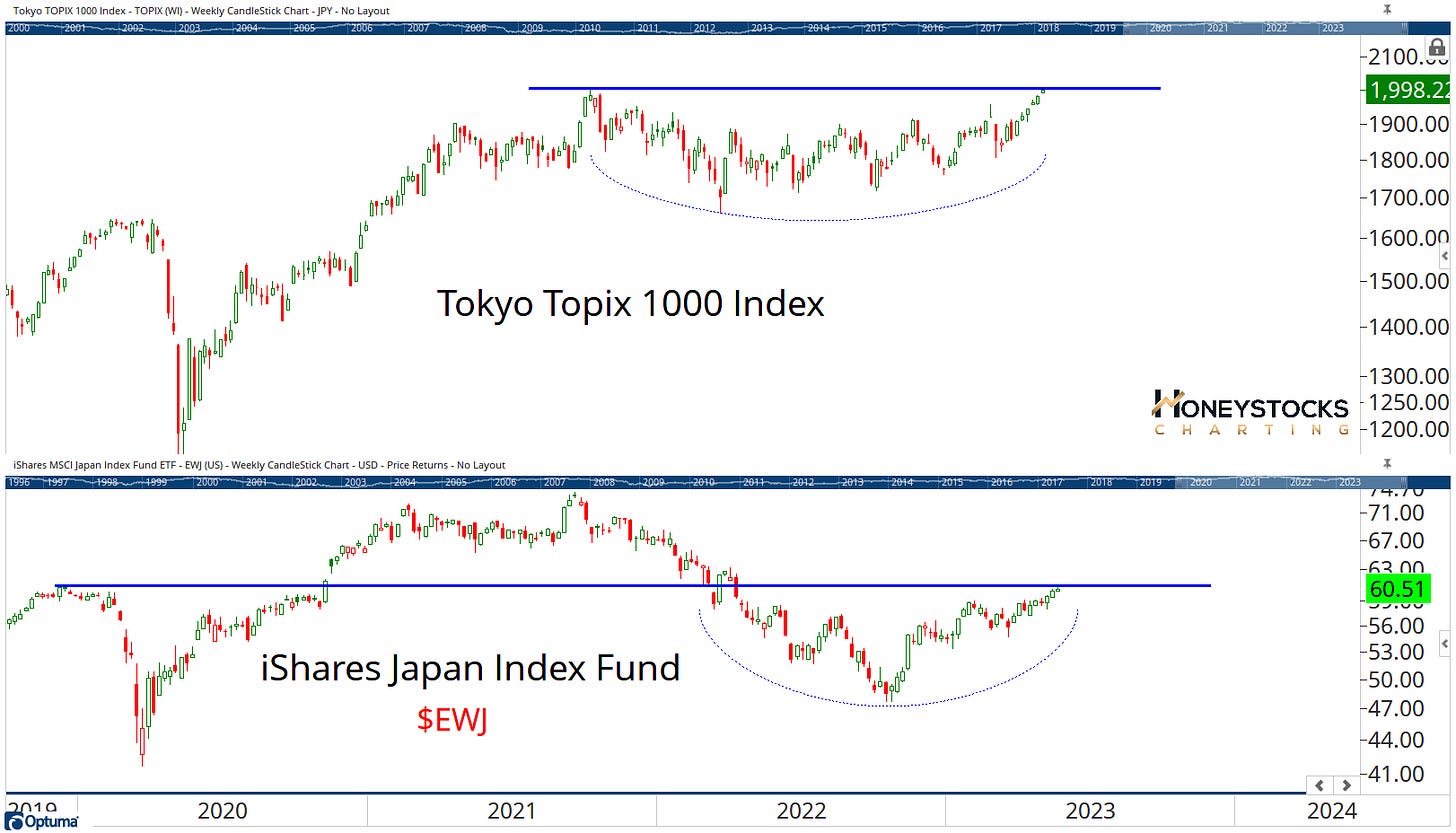
Or how about Japan?
If you don’t like China, how about an Asian alternative.
I have a soft spot for Tokyo and Kyoto (highly recommend a visit), could we break out to new highs taking EWJ higher?
In Conclusion
If you want to buy stocks, there are plenty to buy and if you want to short stocks there are plenty going around too.
Getting caught up on the news of the day might be the easiest thing in the world to do, but I prefer to focus on the charts.
It’s just easier that way.
Let me know, how do you see things?
If you missed our free social media monthly outlook video with 20 massive charts - check that out below, I’m told it’s really good.
Click Below - Check our membership options. We might just make a difference.


