Before I get into this weeks letter, let me clarify so there’s no confusion.
I’m not predicting a corrective phase for European markets.
As most of you know, we’ve been bullish stocks since October last year, but as we get new data (price) coming in, showing new characteristics, it makes sense to re-evaluate what the market is telling us.
After some monumental moves back to all time highs in many of the major European economies, some big charts are now flashing a few warning signals.
In this weeks letter, I’ll be sharing a few of those charts and given it’s an inter-connected global market, it makes a lot of sense to consider what potential declines in Europe could mean across the board.
German DAX
Germany had a face ripping rally off the September lows and has out-performed the S&P500 to the tune of 37% to 21%.
It’s been really good to be invested in Europe, but as the chart shows, we’re now pausing/stalling at logical levels.
Breaking out to new all time highs is always a challenge at the index level, if Germany continues to pause here, nobody should be too surprised.
United Kingdom FTSE
Same story with the UK.
After making new ATH’s, we rolled over with the banking shenanigans a couple of months ago, and as we rebounded from those recent lows, we failed to make a new high.
Lower highs are an issue in my world, and at time of writing, we’re now on the cusp of breaking lower and back below those 2019 highs.
I have concerns with the UK.
Euro STOXX 50
50 of the biggest stocks from Europe are also pushing against significant price levels.
It’s basically telling the same story with the German DAX and if we paused here too, again, it shouldn’t really be a surprise.
France CAC Index
I never like it when major indexes look like they might fail at all time highs.
We all know they can fake to the down-side for a few days before ripping higher, and I’ll add that this is a weekly chart, therefore a weekly close below is required anyway.
But if you’re in to the French luxury goods stocks (Hermes / Louis Vuitton), you might want to consider the implications of a possible failed break out.
In Conclusion
The market isn’t as straight-forward as observing a a basket of 500 stocks.
If you’re reading this letter and you’re fixated on the S&P500, or you subscribe to folks who present a 15min charts of SPY, it’s not that simple unfortunately.
That said, I know many of you like the S&P500, so here’s my current chart.
S&P500 (SPY)
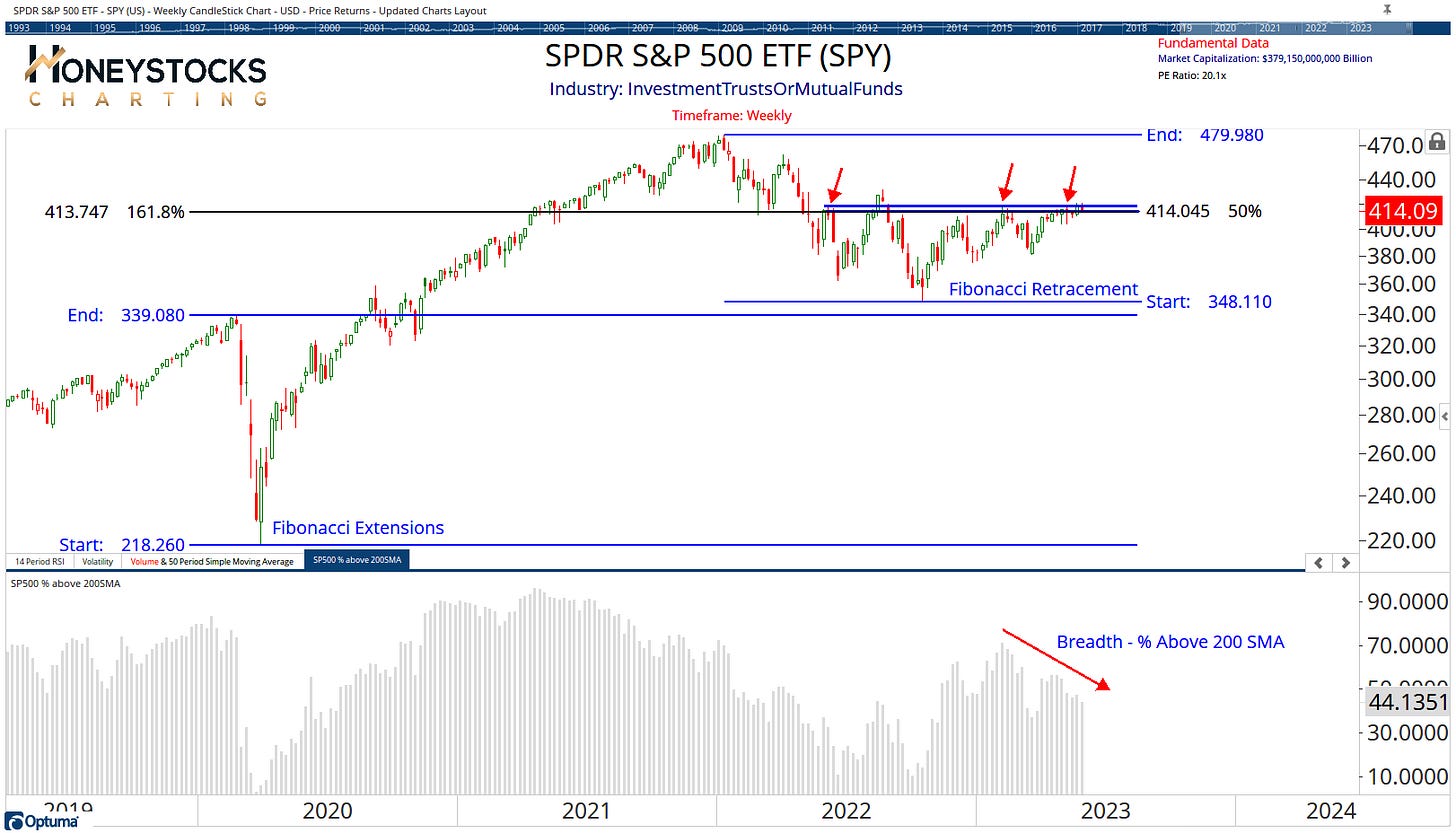
We have debt ceiling shenanigans to navigate whilst the US Markets are stalling at key levels (for me the $413-$420 level is big).
I suspect there’s likely going to be a big move in either direction over the coming week.
For me, it makes no real sense to launch into brand new positions until we’ve safely navigated to the other side of the news.
It’s an endless sea of data points, but the big question I have below, for me, is a logical one.
Could the weakness in Europe, filter into the US Markets?
At the very least, Europe is probably communicating that it’s worth standing back and observing, rather than launching into “buy the dip” mode.
Like everyone, I much prefer stocks going up, so I hope the charts continue higher from here after a small month end pause, but I like to prepare (just in case).
Needing to react quickly with no plan in place is never a good position to be in.
I’ll be walking through a lot of it (and much more) this evening in our Midweek Half Time and our Premium Weekend Analysis for our clients and members on Saturday.
I’ll also be covering our current open long positions in the likes of AMZN, AAPL, TSLA, DKNG, MNST and also begin preparing for all potential market outcomes.
I’ll be paying close attention to the charts, not the headlines.
How do you see it?
Click Below - Check our membership options. We might just make a difference.


