If you find value from my hard work below, please do consider sharing/subscribing.
I also post lots more useful charts and data on Twitter most days.
If you listen to all the mainstream financial media nonsense, there’s a fair to decent chance that you’ve heard some whispers that we’re in the middle of a commodity “super cycle”.
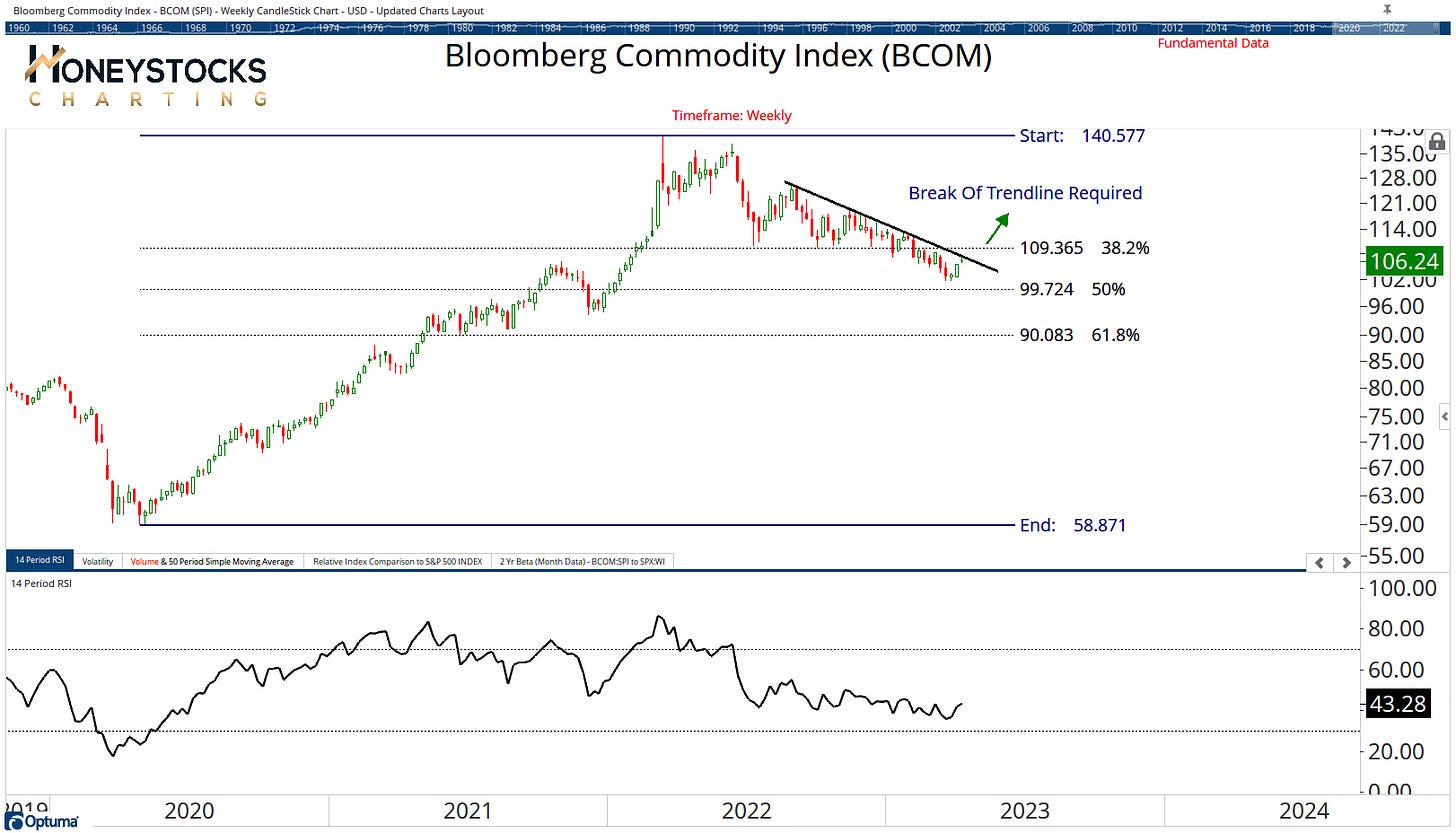
The problem with that is the Bloomberg Commodity Index is down 27% from its highs 12 months ago.
I dunno about you, but that doesn’t seem like a super cycle to me.
In this weeks letter, I’m going to share a few charts from our Commodities chart book because I think we could be nearing some kind of tradeable bottom in commodities and I like to prepare for these things, even if the relative strength is low at the moment.
Let’s start with Mr Bloomberg.
Bloomberg Commodity Index
The sole goal of Technical Analysis is to identify the beginning of a new trend at the earliest possible starting point.
If we look at BCOM, I’m looking for a break out ABOVE the highlighted trend line and to also reclaim that $110 level, if we get that, I think we’re looking at a base bottom and we head off to the races.
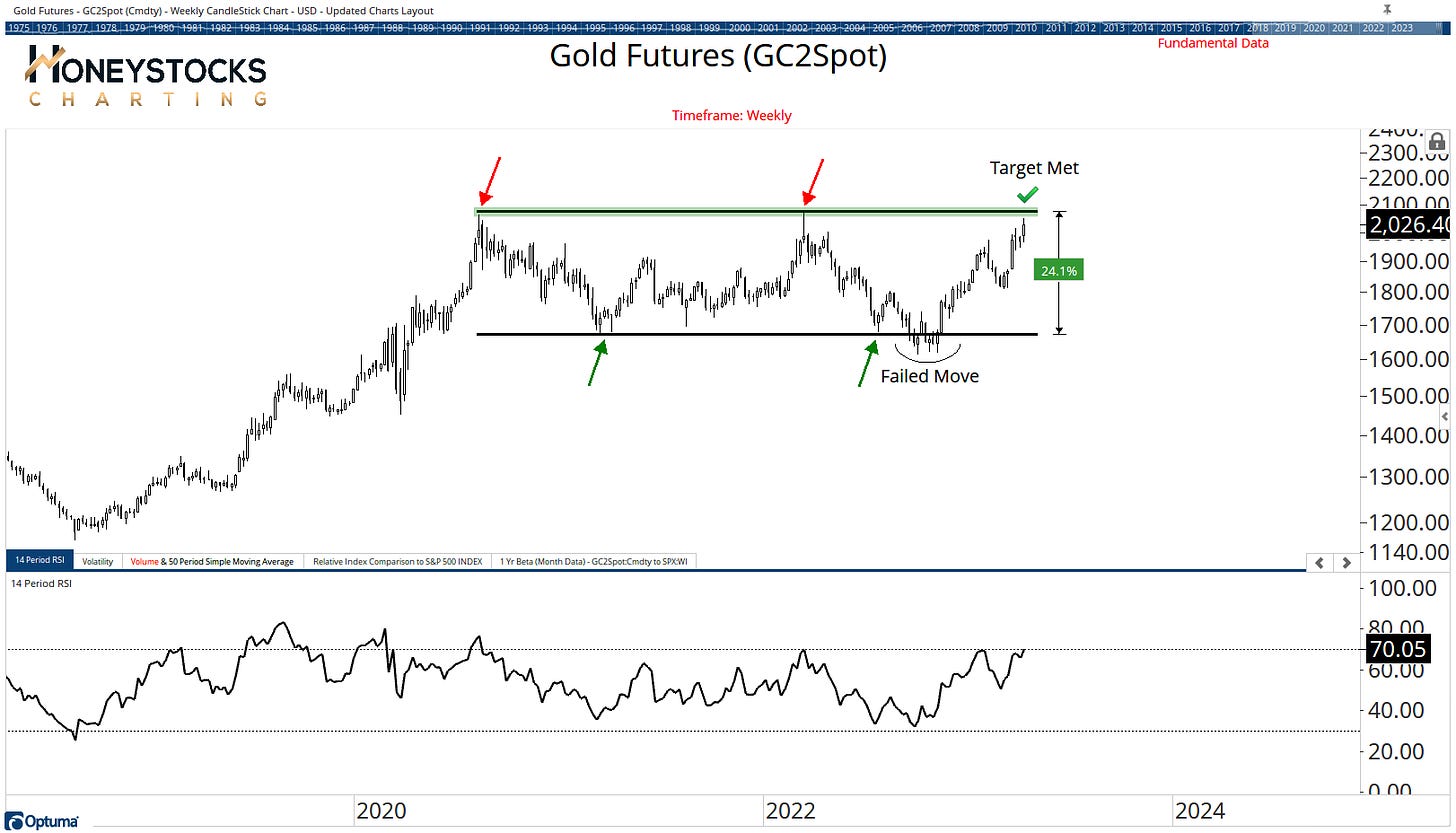
Gold
Gold has now hit our upside objectives, it’s also a good example of how I like to utilise buy low / sell high charting, but if we break out above the $2,100 level, I suspect it’s champagne and caviar time for the gold bugs.
It’s worth adding to your watchlists.
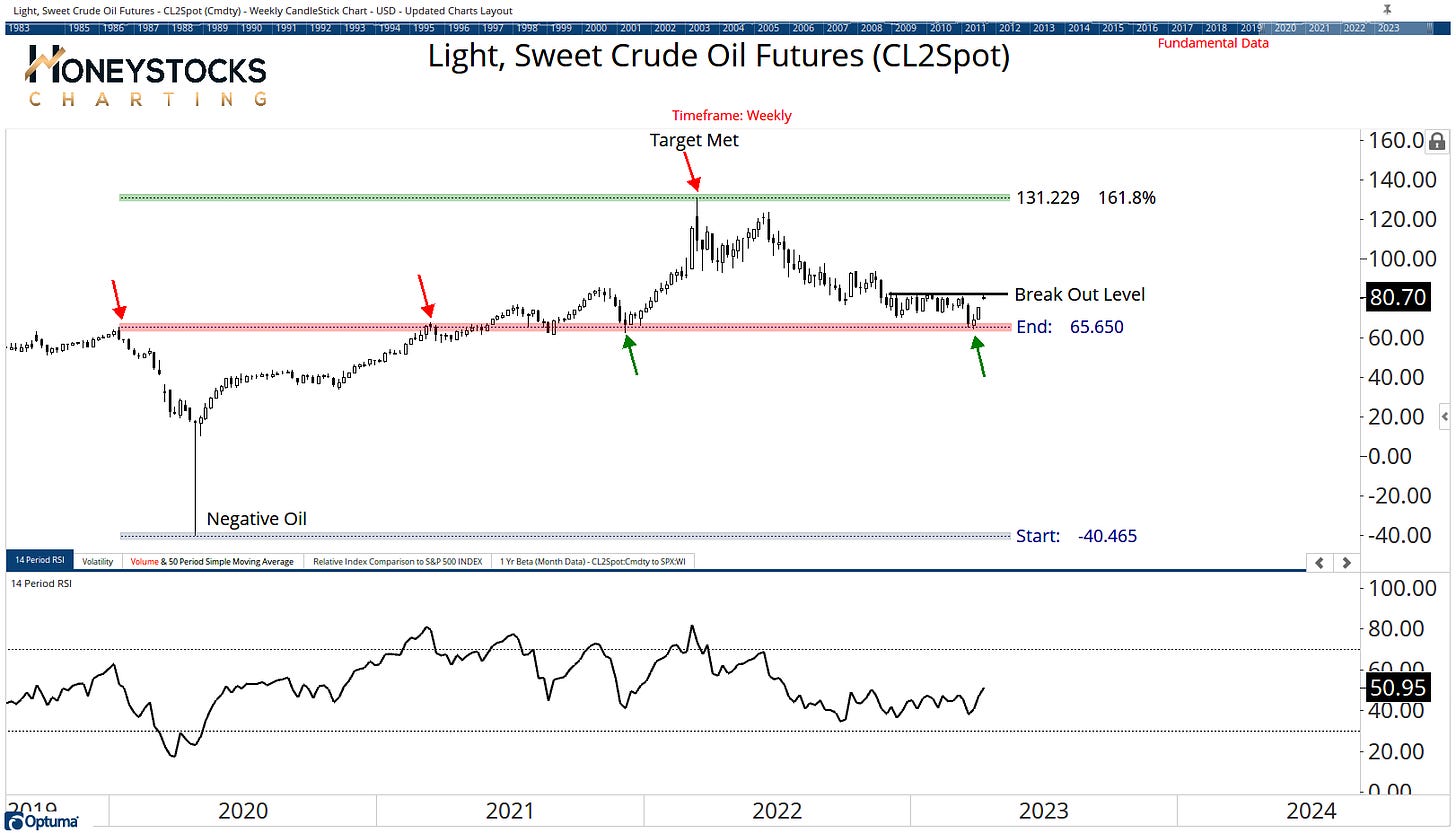
Crude Oil
Even with negative oil prices, our upside targets were met in Oil 12 months ago, and since then, we’ve shaved 50% off the price of Crude set against a backdrop of Saudi / Russian / US shenanigans.
Taking all the news out of the equation, we’re now back at logical rebound levels and I’m looking for a base break out to signal a potential tradeable bottom.
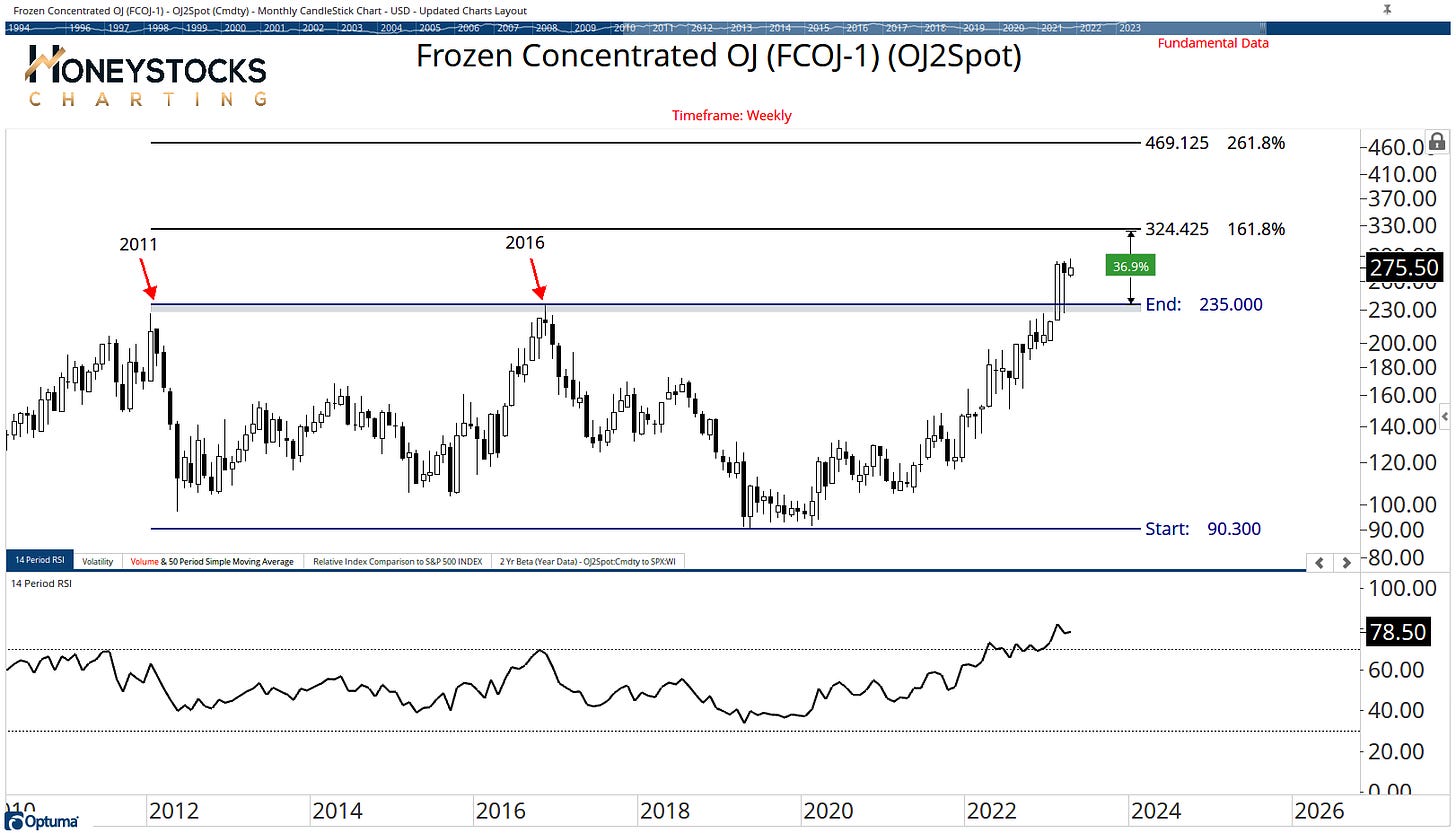
Frozen OJ
The Fib levels are very subjective here, you could use any manner of start/end points on the chart, but we’re working with upside targets around $325 after covering it on the pullback / retest of the $235 Break Out level.
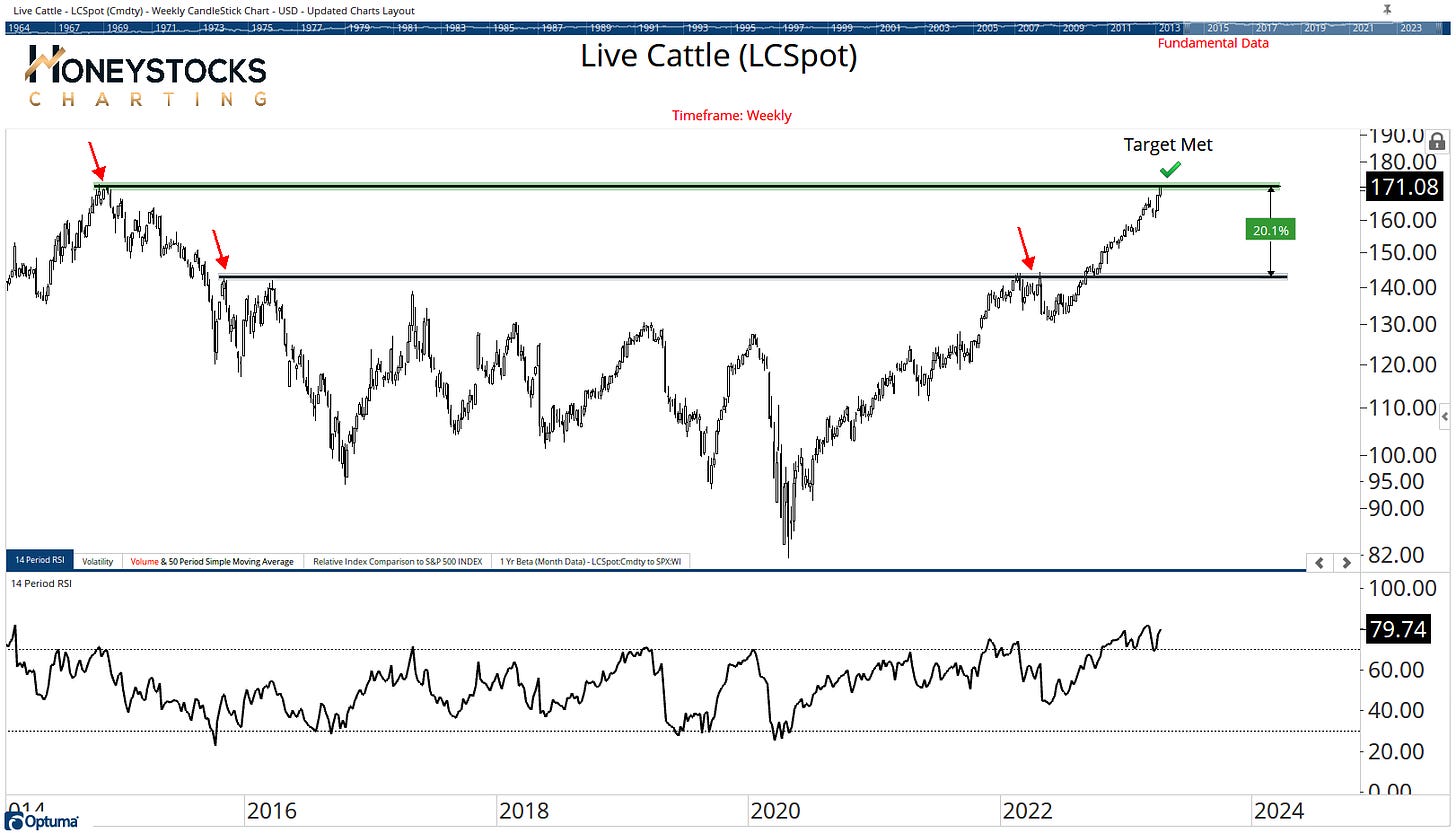
Live Cattle
Similar to Gold, it’s now met our upside objectives, and now we wait for a potential break out. Is Feeder Cattle a clue?
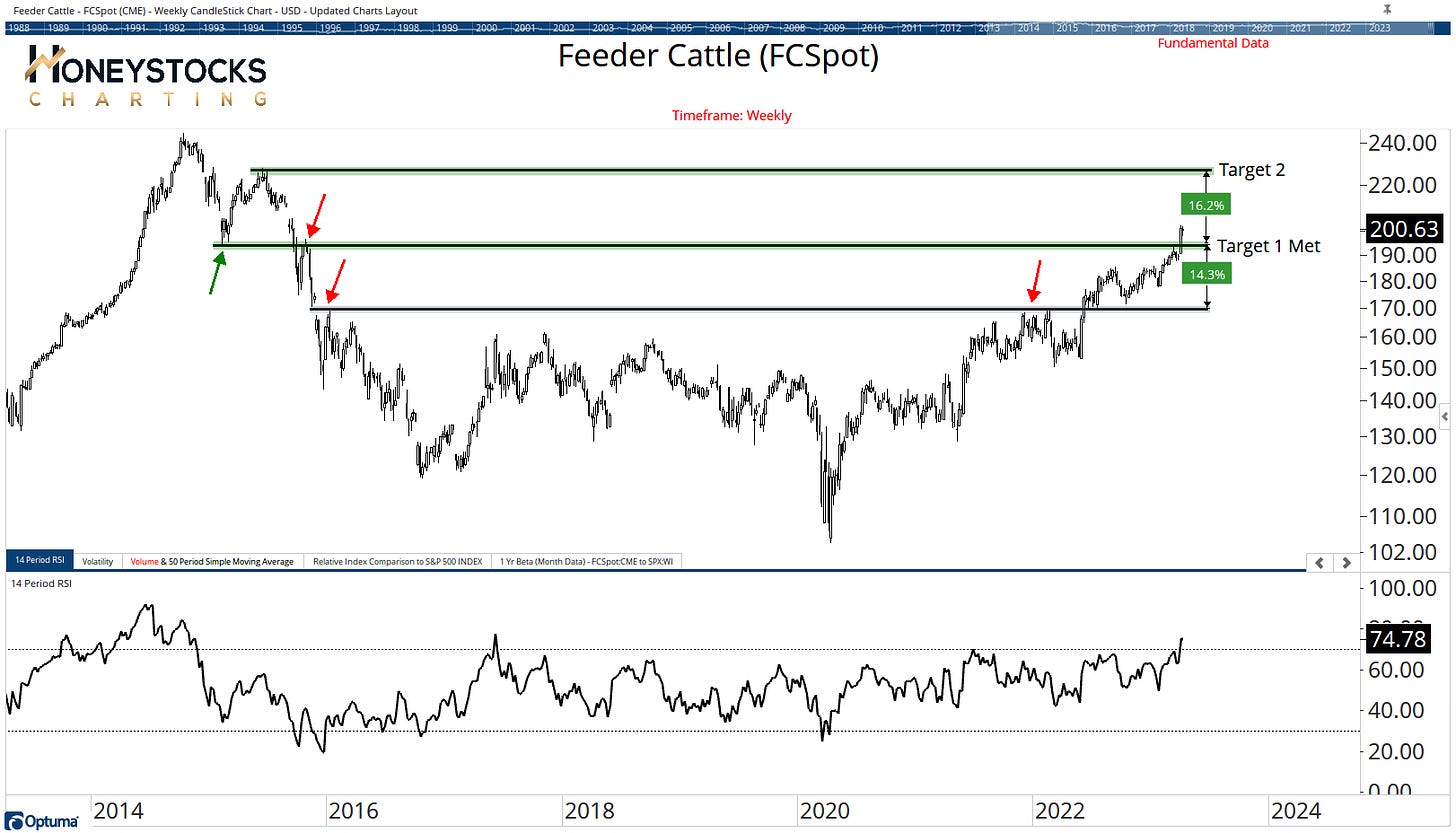
Feeder Cattle
Upside objectives met, but in the last 2 weeks we’ve seen a big move higher.
In Conclusion
In order for a meaningful rip across commodities, you’re going to see the Energy Markets move along with Copper given the weightings they have at the Index level.
My work is geared toward many different markets at the moment and that means lots of buy low : sell high charts, as well as areas showing the early signs of strength.
For me, the S&P500 and Tesla don’t represent the stock market, I’m much more interested in doing the hard yards and running through thousands of charts every week. There’s plenty of opportunity if you know where to look.
Let’s see what the market chucks our way over the next few weeks with earnings season now upon us.
No doubt there’s more shenanigans to come, so I’m staying open minded.
On a side note, I receive many requests every week for a look at my platform - so I’ve attached the welcome tour to our platform below for anyone considering any of our membership options.


