As we move into January month end, the markets around the world continue to move higher set against a negative back drop of mass job layoffs and economic damage.
As you know, I’m not here to focus on economic data because it’s just not useful for my process, I’m not an expert on it, so I just make a conscious decision to discard it and focus on the only data points I believe matter.
Human behaviour and price.
The signs of a rotation back into Tech after an 18 month hiatus were written in big capital letters 2 weeks ago.
My letters and work over the last couple of weeks have done a very good job of covering it, but in this weeks letter, I’ll try my best to provide a little more context.
So far this year, there’s been close to 60,000 US job layoffs in the Technology sector.
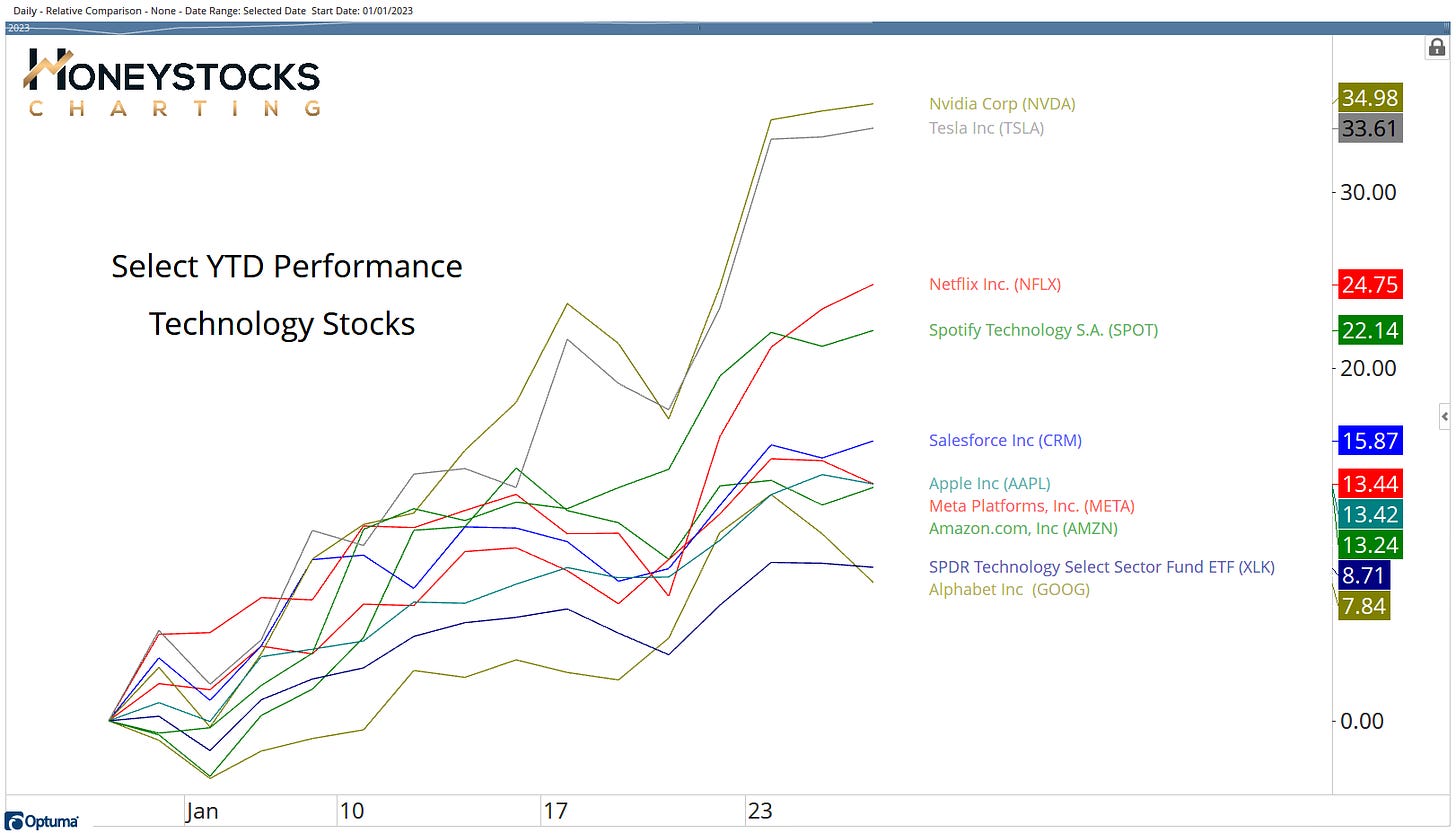
Technology stocks meanwhile….
Technology Stocks YTD Performance
Disclosure: In January, Our Clients / Members have been provided charts for $NVDA, $TSLA, $NFLX, $AAPL $META, and $GOOG.
As we move into earnings season, we’ve already seen $TSLA put up strong numbers, $MSFT was very blah, but next week we have big hitters like $AAPL, $AMZN and $XOM all reporting.
It promises to be another exciting week.
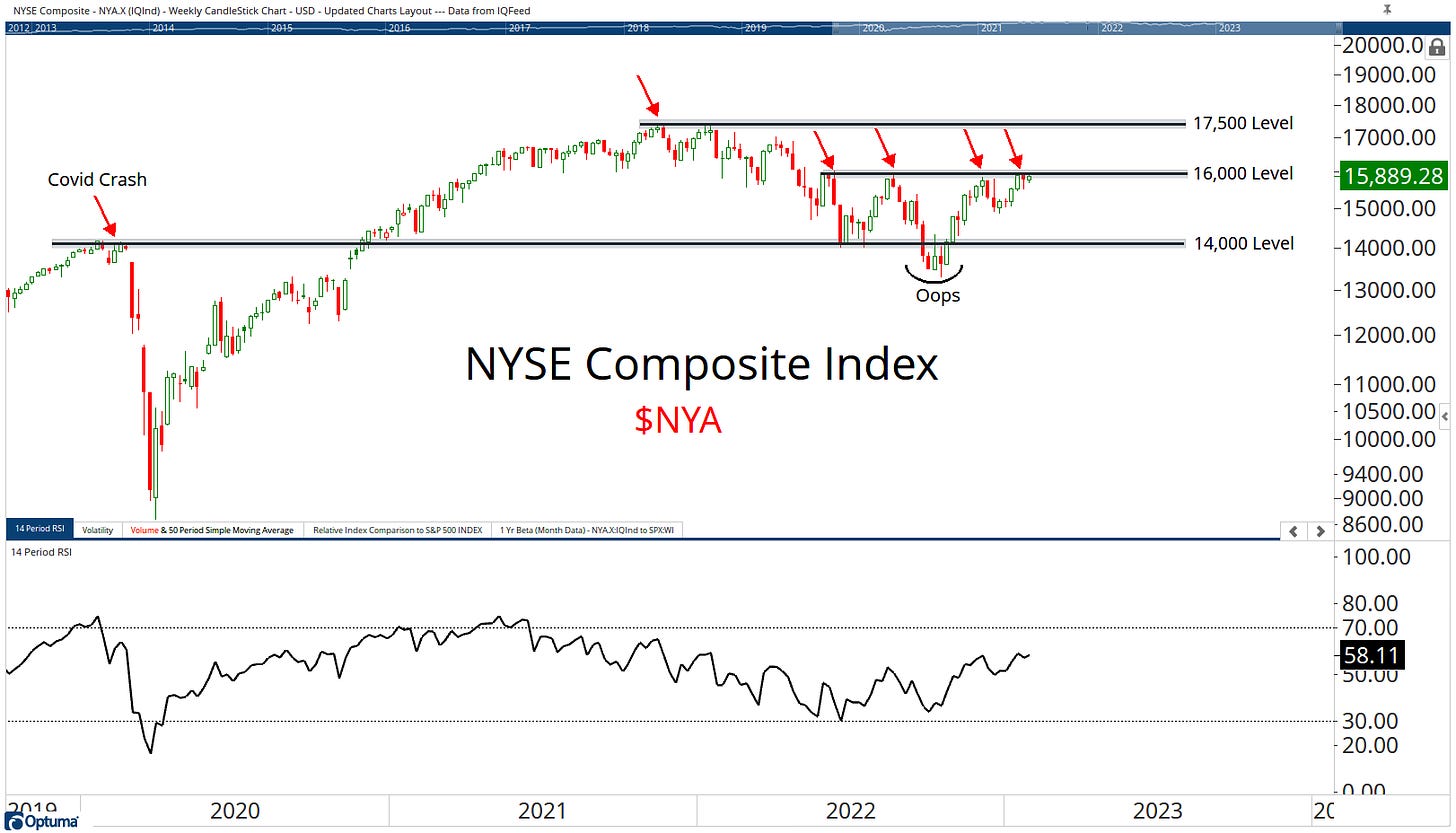
NYSE Composite ($NYA)
If you’ve followed my work for more than 5mins, you’ll know this has been a BIG chart for me (along with the US Dollar ($DXY), simply because it represents the US Markets better than a basket of 100 or 500 stocks.
If we break out above that 16,000 level, that leaves only 8% upside to test All Time Highs after an almighty 20% rip from the lows in October.
What about the S&P500?
Like most of you, I’m sick of the sight of the S&P500 trend line, so here’s a different take.
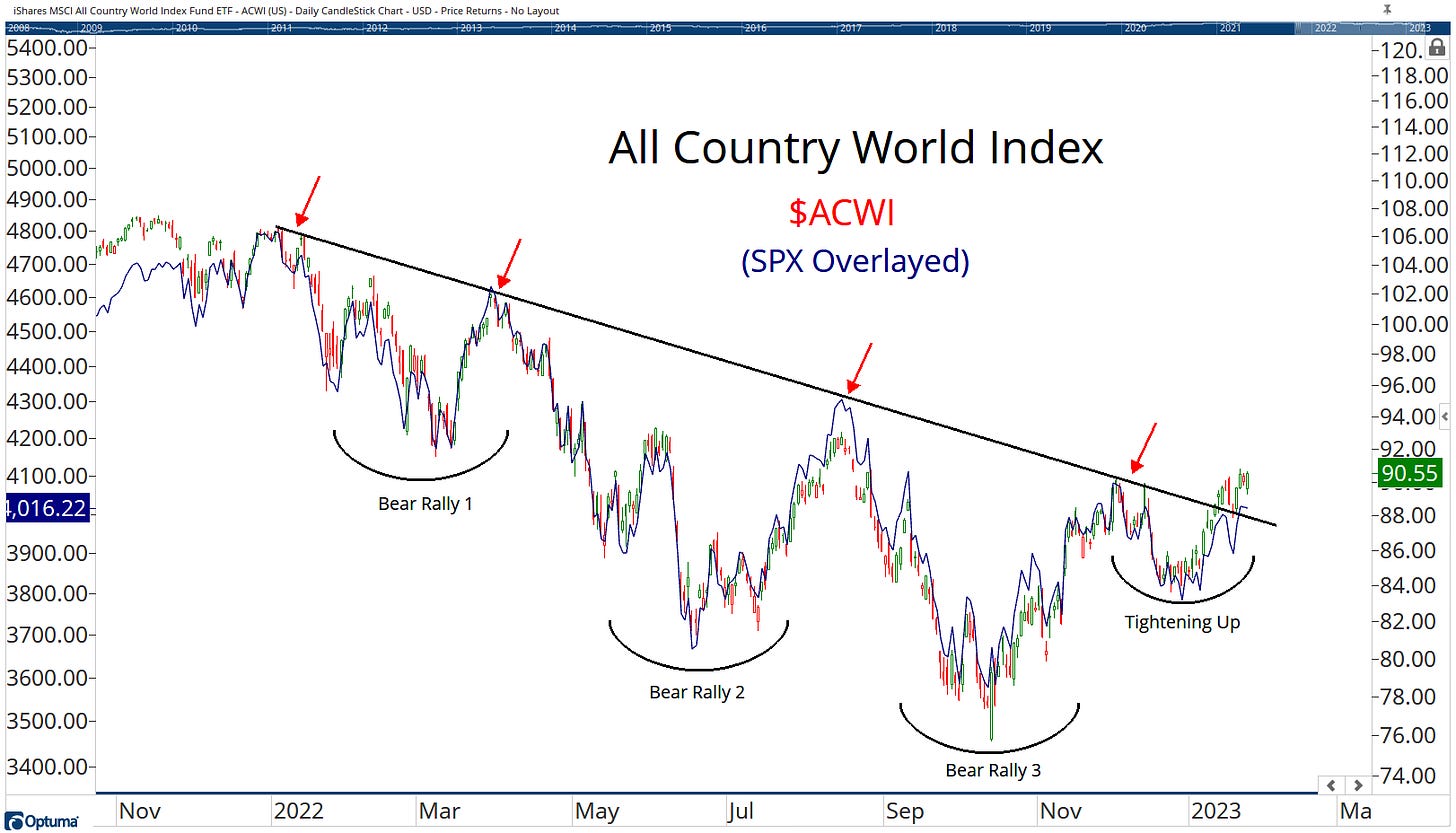
All Country World Index ($ACWI)
Given there’s a strong correlation with the S&P500, I’ve been looking for clues to what comes next for the US Markets
The $ACWI chart broken above it’s own trend line a couple of weeks ago… could the S&P500 follow?
If we get break outs in the major averages, is that a signal to get more bearish, or do you think it would be more sensible to do what price is doing?
I leave that question for you to answer.
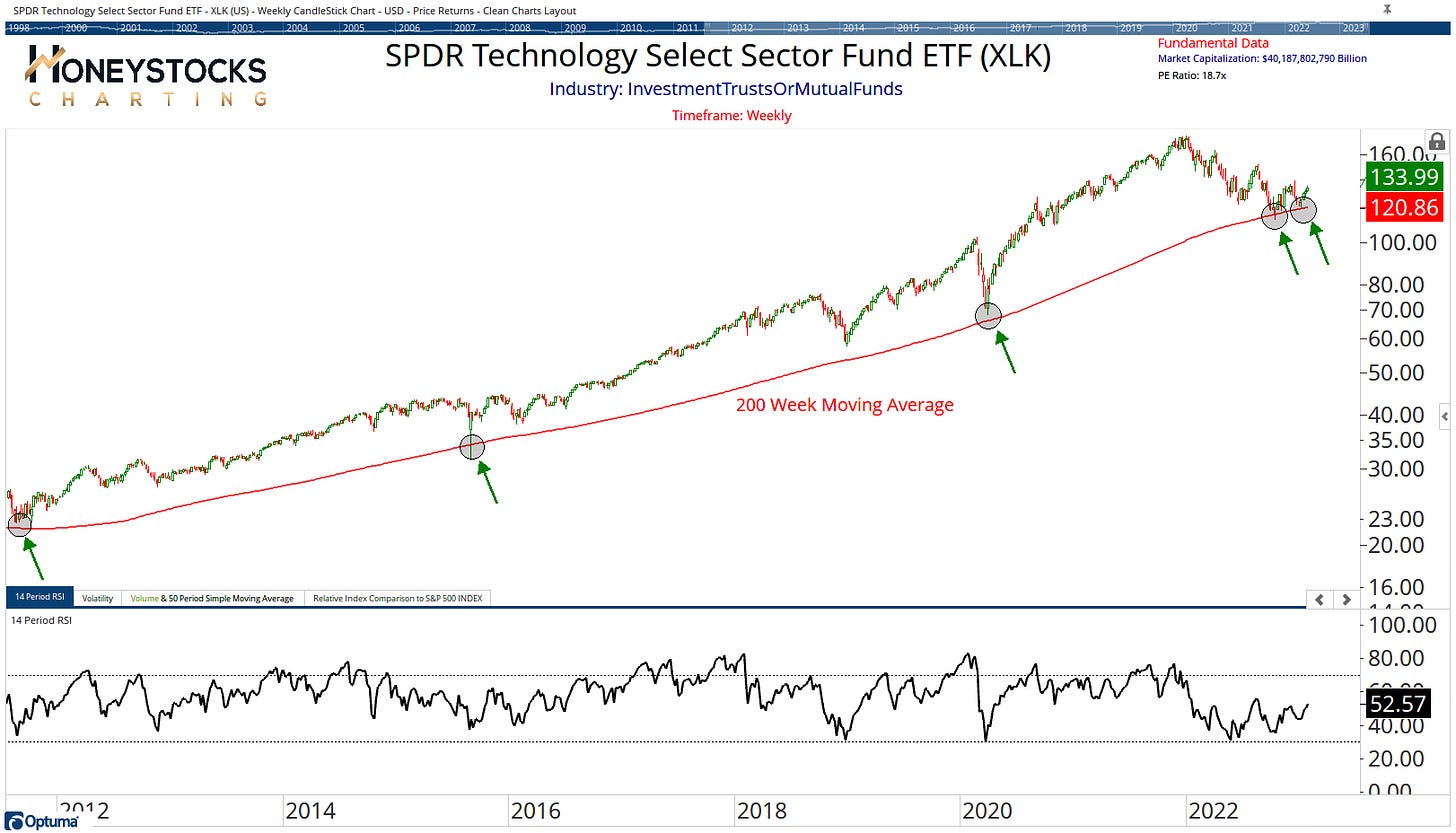
SPDR Technology Sector ($XLK)
I don’t like to over complicate my work, the 200 Week Simple Moving Average has held up for 12yrs now.
Considering tech stocks at these levels just seemed like a really sensible thing to do.
How about some individual names to consider?
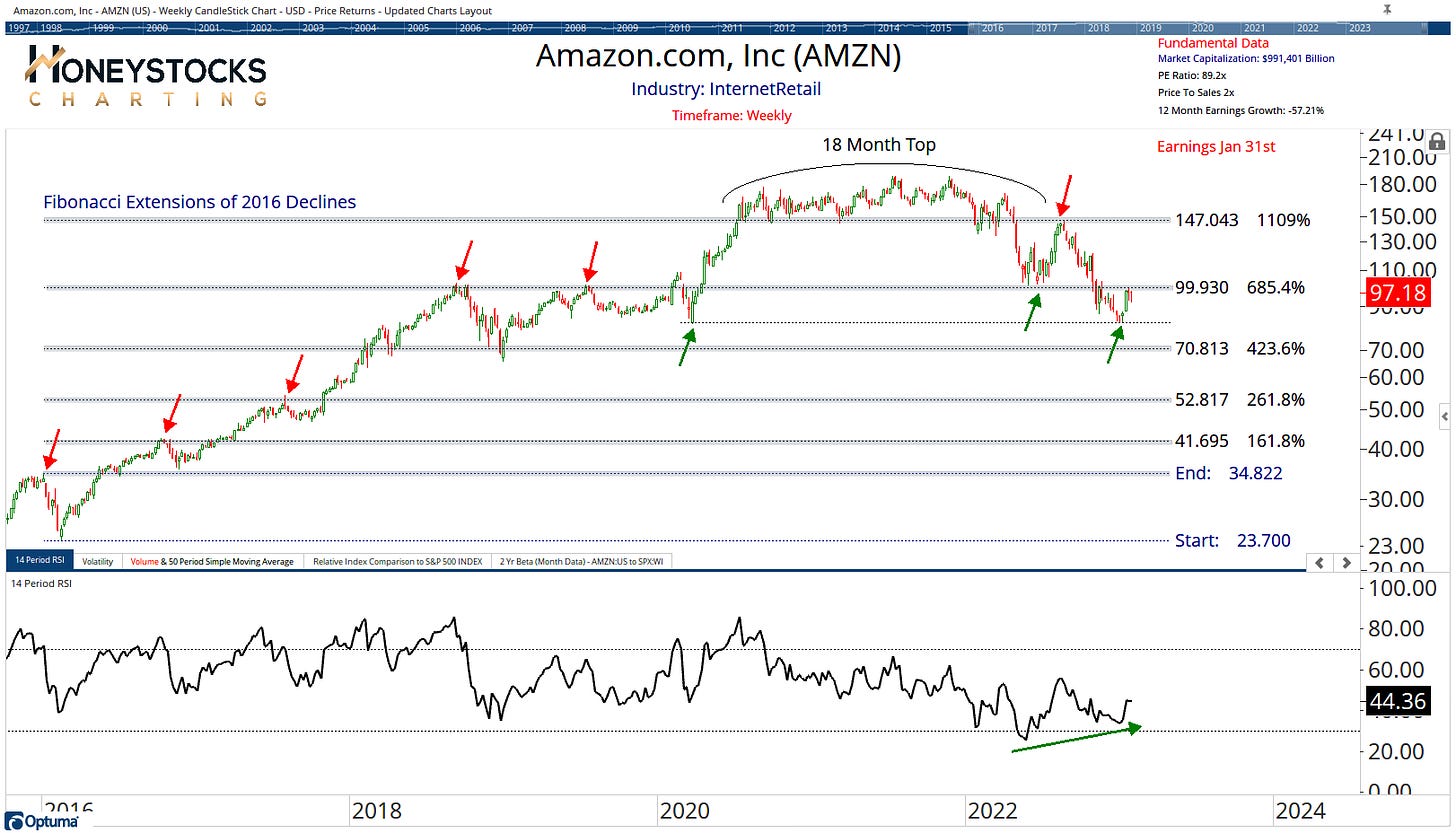
Well, given we have earnings coming up, I think $AMZN might make sense but it’s going to be something to consider next week POST earnings if it can break above the levels highlighted.
Amazon ($AMZN)
I don’t expect many of you to pick up on Mr Fibonacci here, it’s usually just us professionals who pick up on these things, but if it gets above that $100 level, I think there’s 50% upside and I won’t be second guessing job losses or the economy.
I also laid out a bunch of charts at the weekend ICYMI.
Conclusion
There are plenty of stocks doing incredible things.
Whether it’s the copper miners hitting 50% upside targets or semiconductors gearing up again, there truly is something for everyone.
You just need to know where to look.
And if the economy does catch up with the stock market, that’s ok too, the basics of risk management (trailing stops) will take things out when price says so.
Systematic process will always trump thoughts and feelings. True story.
You should probably check out our Premium work. It’s very reasonably priced.


