Unless you reside on the moon, the two most overcrowded “trades” of 2022 have been the US Dollar and Energy.
Over the past month we’ve already seen a mini collapse in the US Dollar, I covered that 6 weeks ago (before it happened) - WEEKLY LETTER HERE .
The questions I’m posing this week,
Is the market now also flashing Energy warnings signals?
Could the Energy trade be about to unwind?
Lets start off with some data.
YTD Performance in Select Energy Names
There’s a very clear and obvious divergence between Oil and Energy stocks.
They’ve been moving in opposite directions for months now and many are asking how long can this continue?
It’s not an obvious answer, but lets break down a few charts.
Brent Oil Chart
This is a chart that’s taken from our Commodities chart book (available to our clients / members daily).
Brent Oil met our upside objectives back in March.
There’s really been nothing to get excited about since then, but now that we’re pushing down and potentially breaking below big technical support levels, the commodity charts are swinging back into focus.
Same story with Crude.
Our Targets were met back in March, since then we’ve had a steady stream downward and now that $65 level is looking like it’s going to be a pivotal level.
Will the commodities finally lead energy stocks lower?
We’re probably getting close to an answer to that question
Over the last couple of months, I’ve been working with a straightforward thesis that XOP and XLE will move toward upside objectives (outlined below), but now that 1 of the commodity dominoes is potentially breaking rank, it’s now bringing into question my thesis, and like all professional analysts, when price tells me something different, I like to listen.
For me, there’s an inherent problem with shorting stocks / areas of the market that are close to All Time Highs.
It’s not that I don’t advocate it, it’s just the technical setups are always few and far between and unless you short at the exact moment a test of ATH’s is made, it becomes a chasing game.
Lets take a quick look at a couple of Energy names.
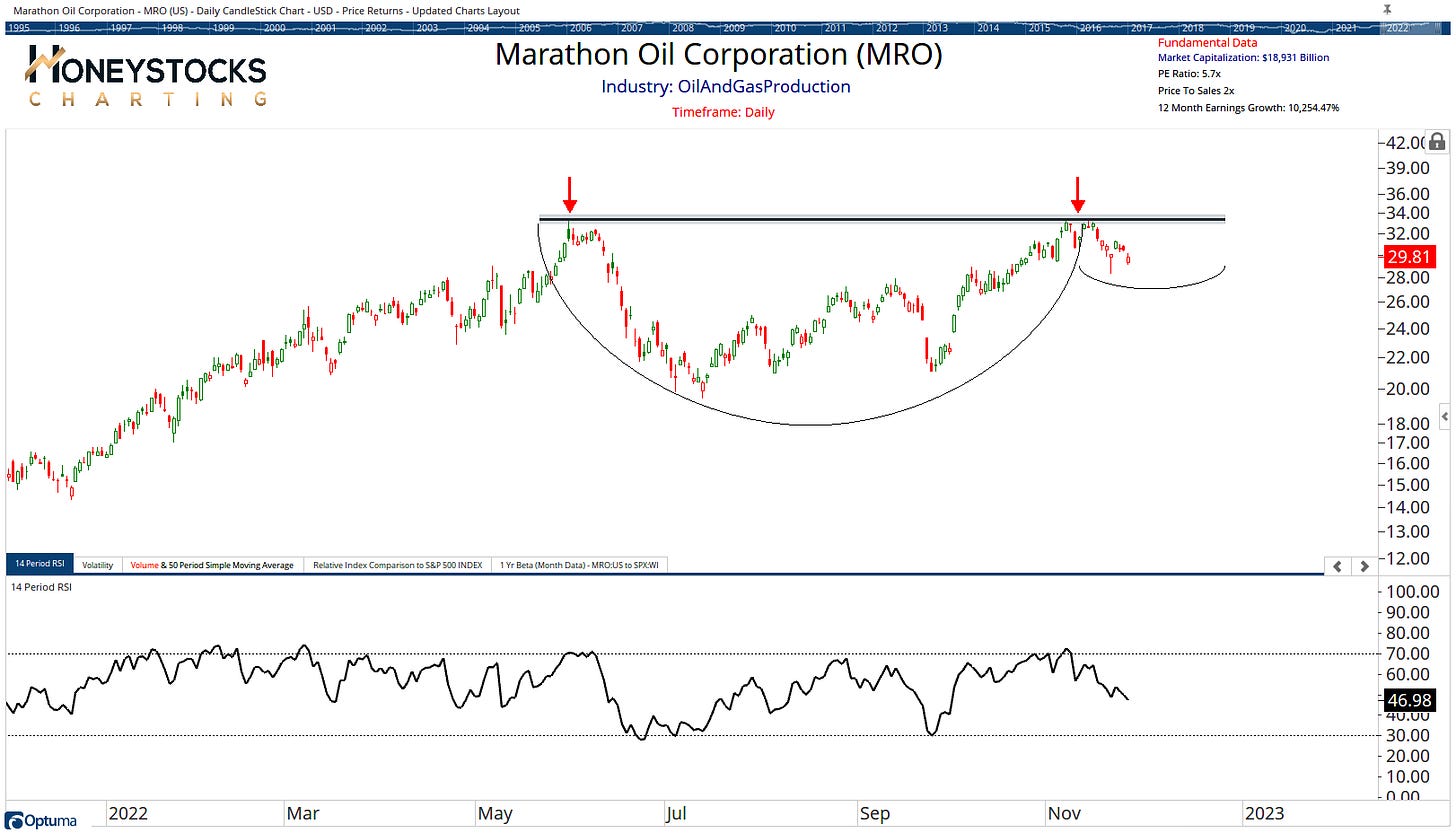
Marathon Oil & Occidental Petroleum
A lot of energy charts have this look.
Setting up with bullish patterns
Consolidating in a sideways range
If you’re looking to short these charts, I’d suggest you’re more likely to have your face ripped off.
“Strong technical charts, strong earnings growth, and reasonable P/E ratios. I’m not reinventing any wheels around here.”
The stock selection criteria I laid out back in January has been our mantra all year and energy still ticks all these boxes.
In Conclusion
Energy has been great, many of the individual charts are still setting up in a bullish manner so I’m not ready to throw in the towel just yet. I don’t see the point in shorting uptrends.
What would it take to get bearish with minimum stress?
I’d want to see 1 of a few things.
Crude below $65
XOP and XLE hitting target levels
Failed break outs with individual names
We could be in a bearish position over the coming days, but I don’t think we’re quite there yet.
I’ll continue to monitor price, what will you be watching?


