Before I get into this weeks charts, if you find value from my charts, it would mean the world if you considered forwarding this tiny letter to like-minded friends so I can continue to grow.
Letter (21st Nov 2023)
I always know when I’m onto something when my email inbox gets bombarded with abusive messages whenever I take what some folks consider a controversial view / position on the market.
I love it. Absolutely love it. It just confirms I’m moving in the right direction.
So thank you in advance to those who like to participate negatively with my work.
This week, I’m hearing lots of rumours the market is going to sell off because of valuations and (insert another made up reason here) so hopefully I can continue to bring a wee bit of sense to the charts for you.
But lets start by collectively repeating after me….
“Rotation is the lifeblood of a bull market”
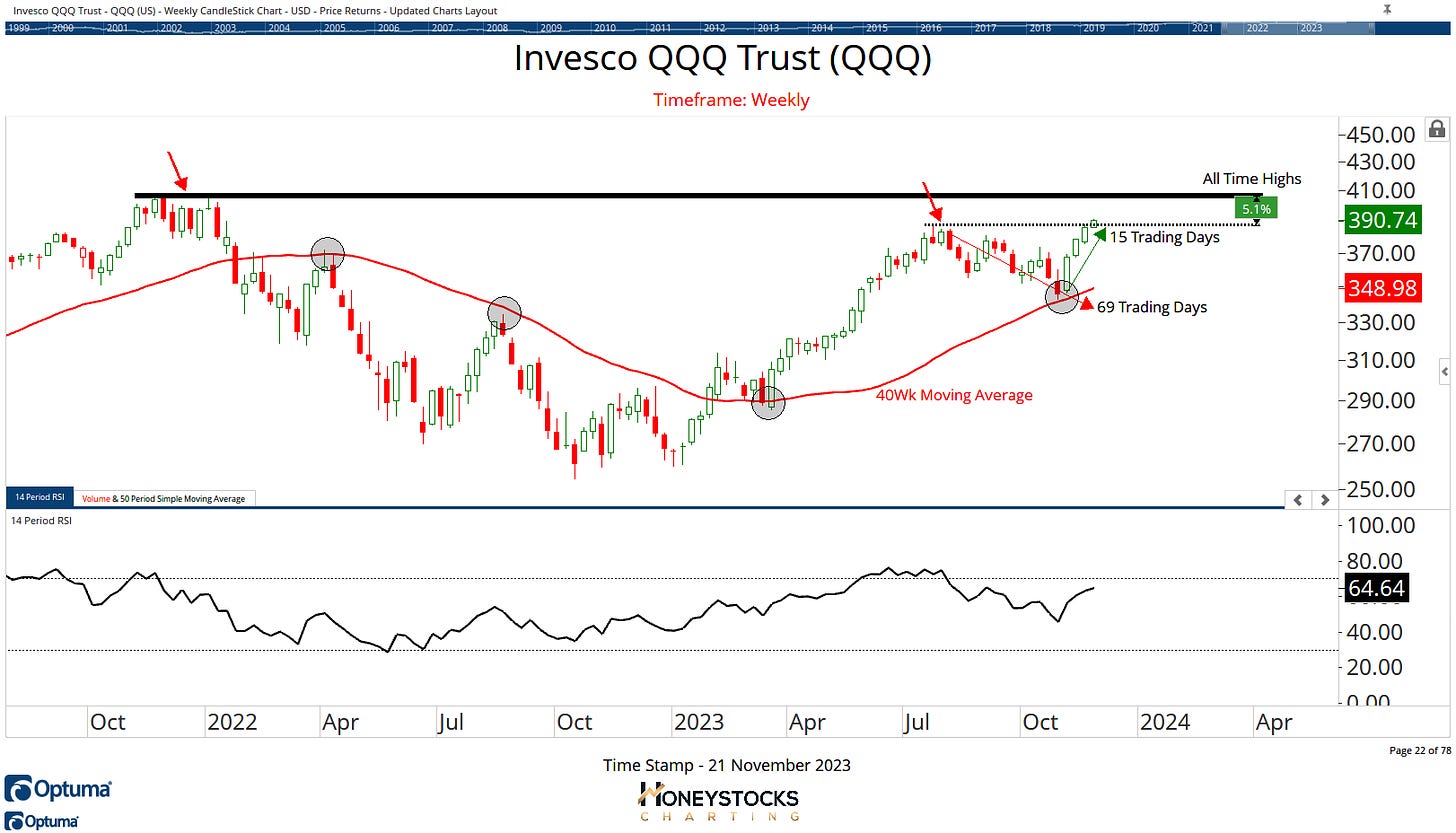
Invesco QQQ
It took 3 months to shake everyone out the market and only 3 weeks to rip back to fresh YTD highs.
Funny how technical analysis helps huh?
In my world, we’re now on the final run toward ATH’s with another few 4-5% left to squeeze out.
We’ve already met our upside targets in many of the individual mega cap tech names we’ve been covering for our clients / members.
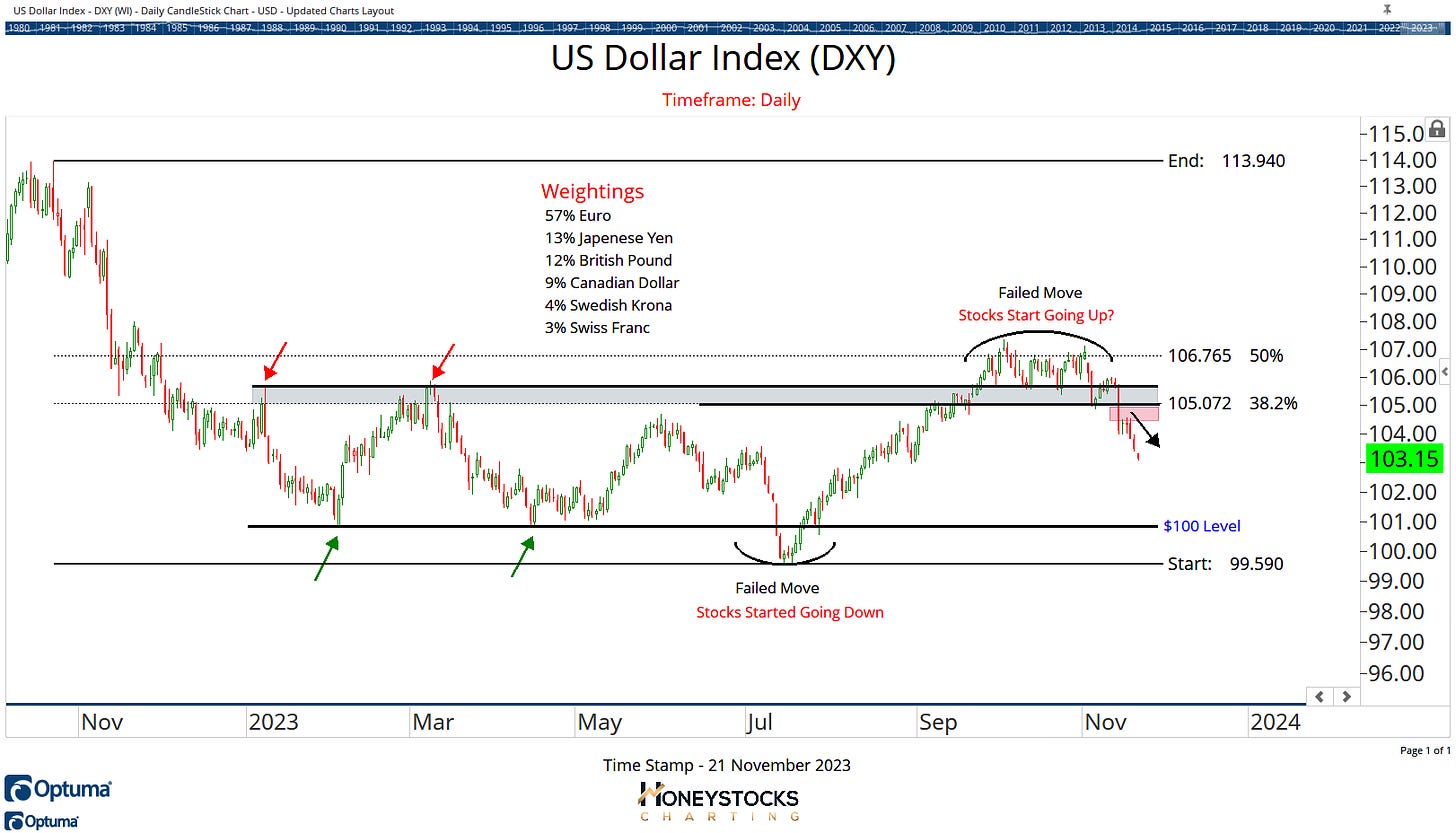
US Dollar Index (DXY)
Central to the current bull case for stocks after the recent. perfectly healthy correction is the US Dollar.
It’s nothing new, I’ve been incredibly vocal about this chart for years, and for this current phase of the market, I’m eyeing up a bearish move to $100 (potentially a market pause level).
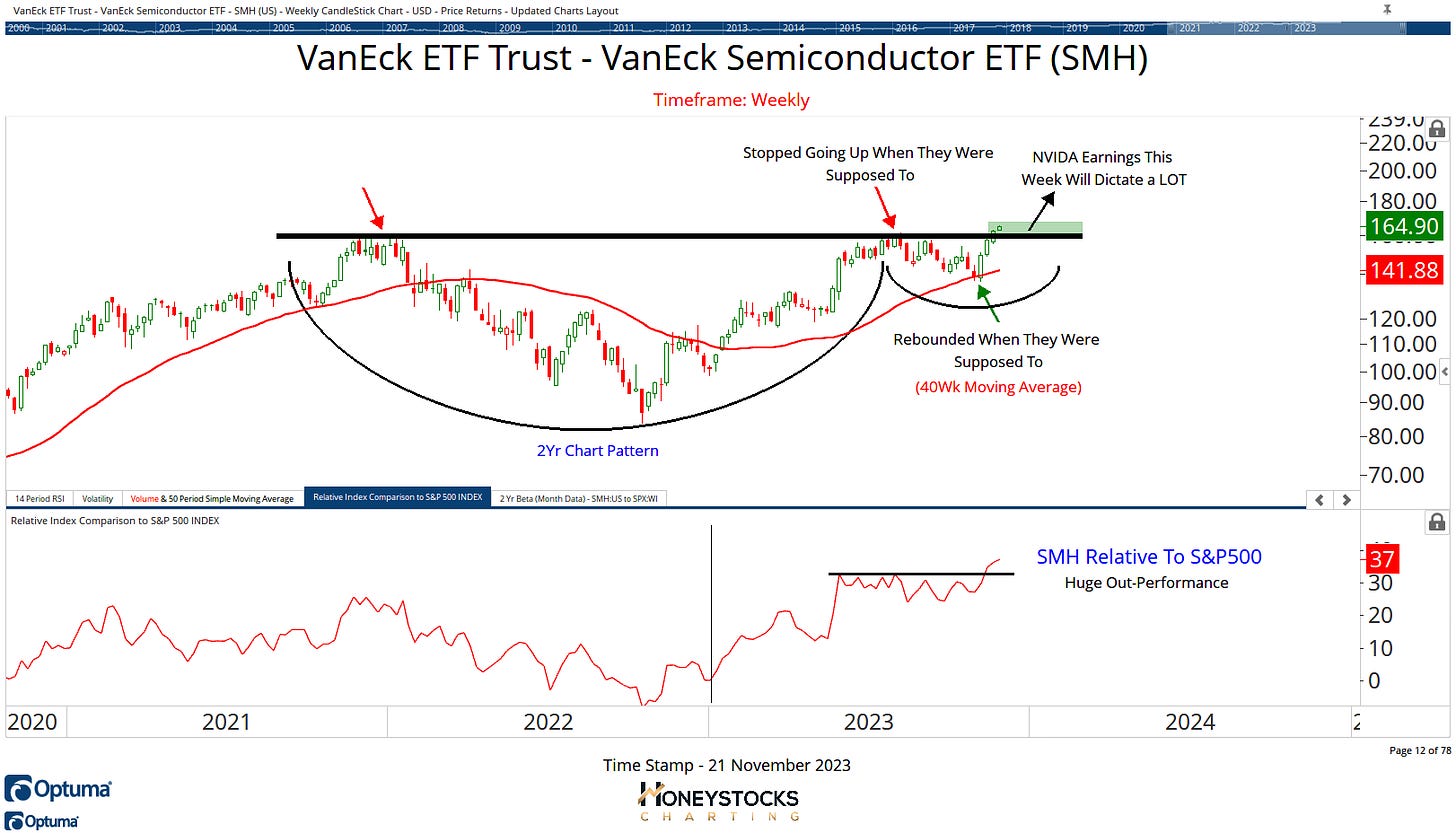
Semiconductors (SMH)
It should be said, in the next 24hrs, we’re going to see some volatile moves in the market as Nvidia report earnings after the market close, hot on the heels of semis breaking out to fresh all time highs on both an absolute and a relative basis.
Nvidia Corp (NVDA)
I presented the Nvidia chart a couple of weeks ago and think it’s worth updating it for y’all now that we’re going out at new all time highs.
NVDA & SMH are mirror images so provided Nvidia doesn’t shit the bed with earnings (which is VERY possible), using the $500 level as a guide, we’re working with lofty upside targets but will now visit the chart POST earnings.
Important Point: I NEVER advocate gambling on an earnings outcome with our clients / members because it’s too much of a lottery.
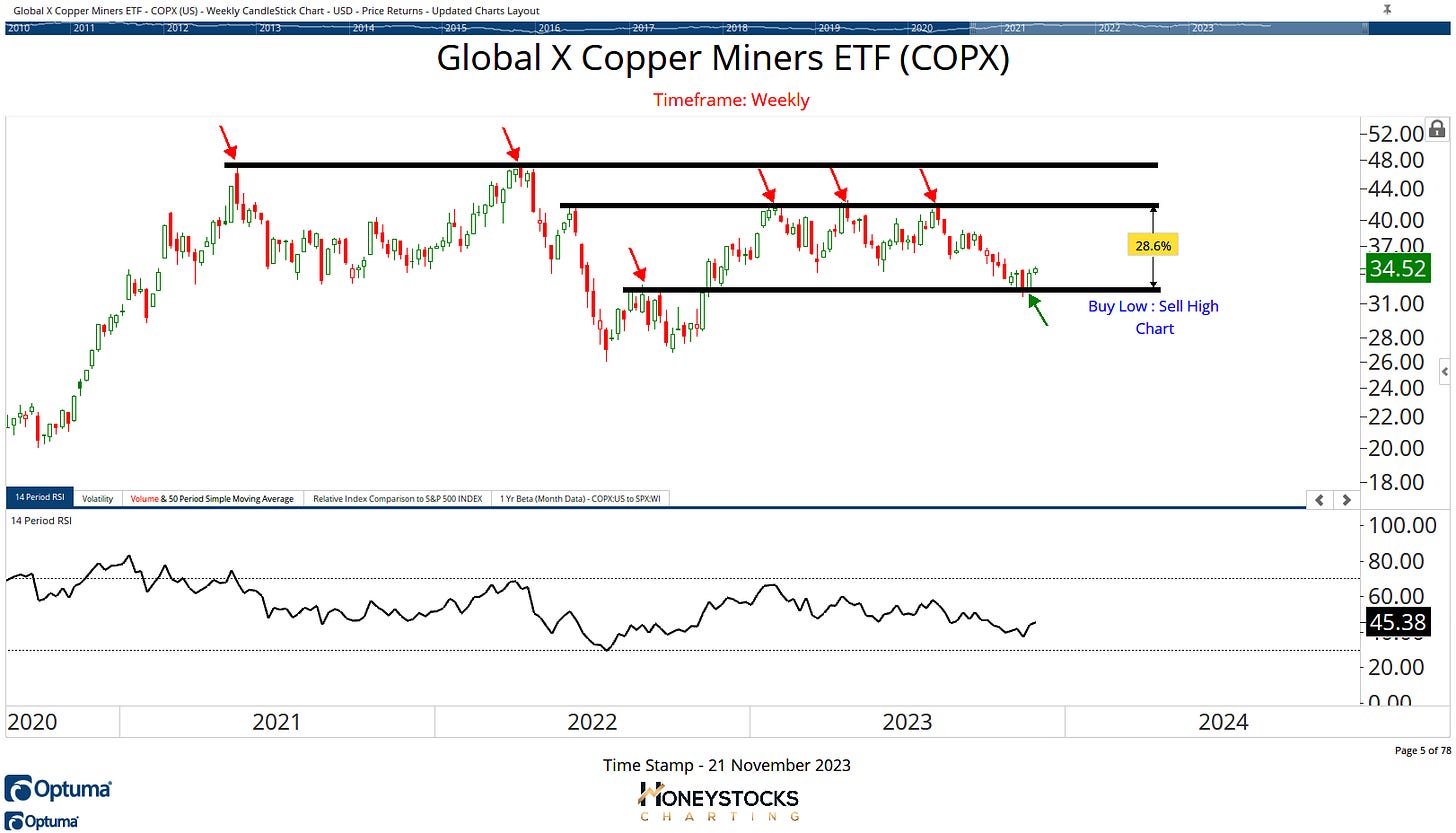
Copper Miners ETF (COPX)
Going back to the “rotation / lifeblood / bull market” thing I mentioned a minute ago, if tech is going to take a well earned breather soon, you could potentially start looking at many of the great buy low : sell high charts.
Copper Miners have been 1 of our ETF candidates over the last couple of weeks in preparation for a rotation.
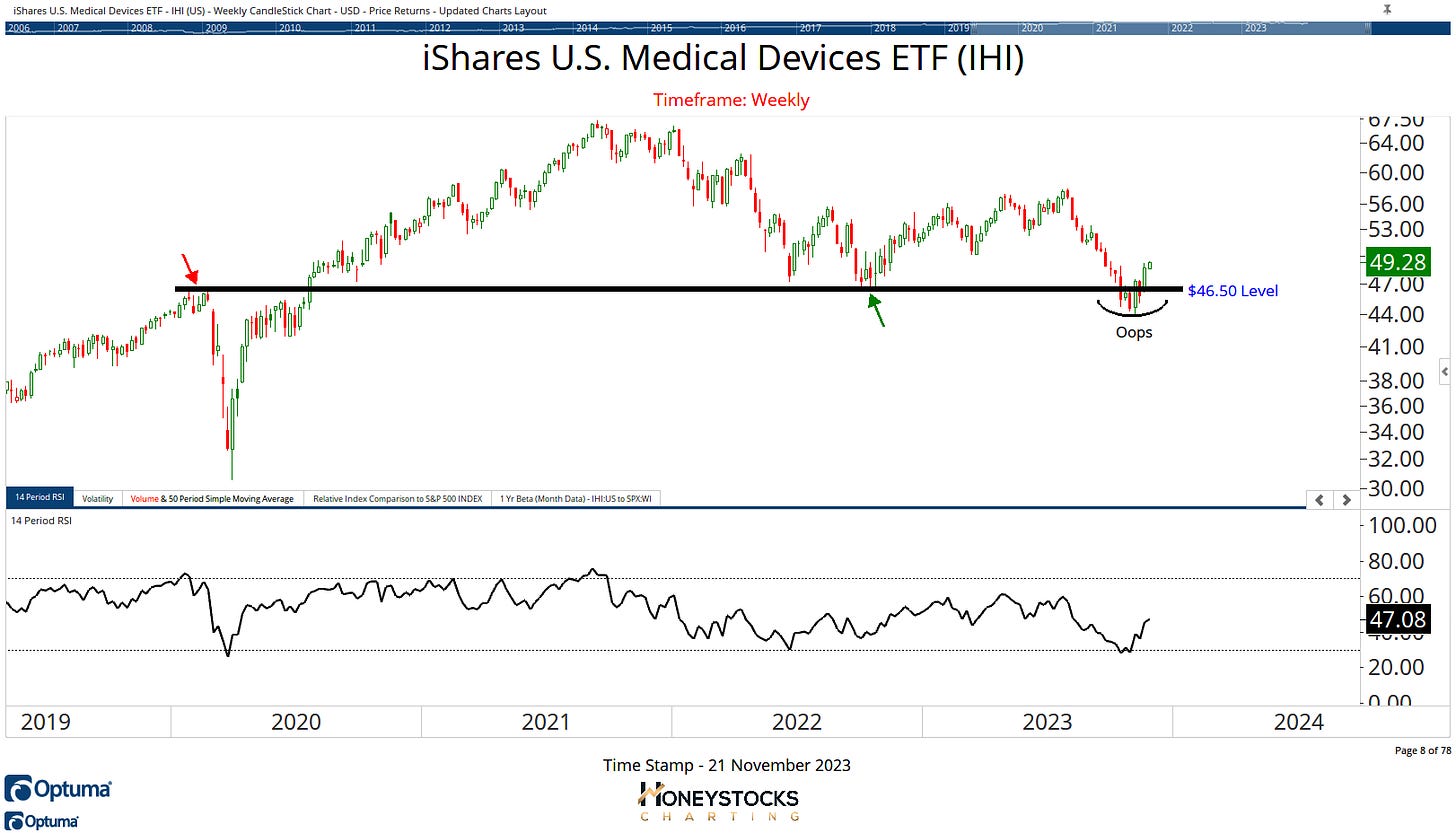
Medical Devices ETF (IHI)
Another of the charts from our ETF Chart book is the potential failed move developing in Medical Devices.
If you follow me on X/Twitter you’ll have noticed I’ve started to get pretty vocal with the relative strength parrots out there.
They don’t like the charts of Copper Miners and Medical Devices, but you can reliably take it from me, relative strength at its source is completely random and these charts have just as much chance of playing out as those break outs to all time highs.
True story.
In Conclusion
I like to identify trends BEFORE they make those 30% moves and show up on everyone’s scanning software.
Most technical professionals have forgotten the whole point of technical analysis is to identify trends at the earliest possible starting point so my technical work is quite unique in that respect.
I love buy low : sell high charts.
I’ve gone on record with my views that it’s among the dumbest things I’ve ever heard to only focus on all time highs when coming out of a correction.
Anyway, I can see I’m rambling again, so I’ll cut this weeks letter here.
To those in the US, have a wonderful Thanksgiving.
See y’all next week sometime.
Access All Our Chart Books And Premium Work


