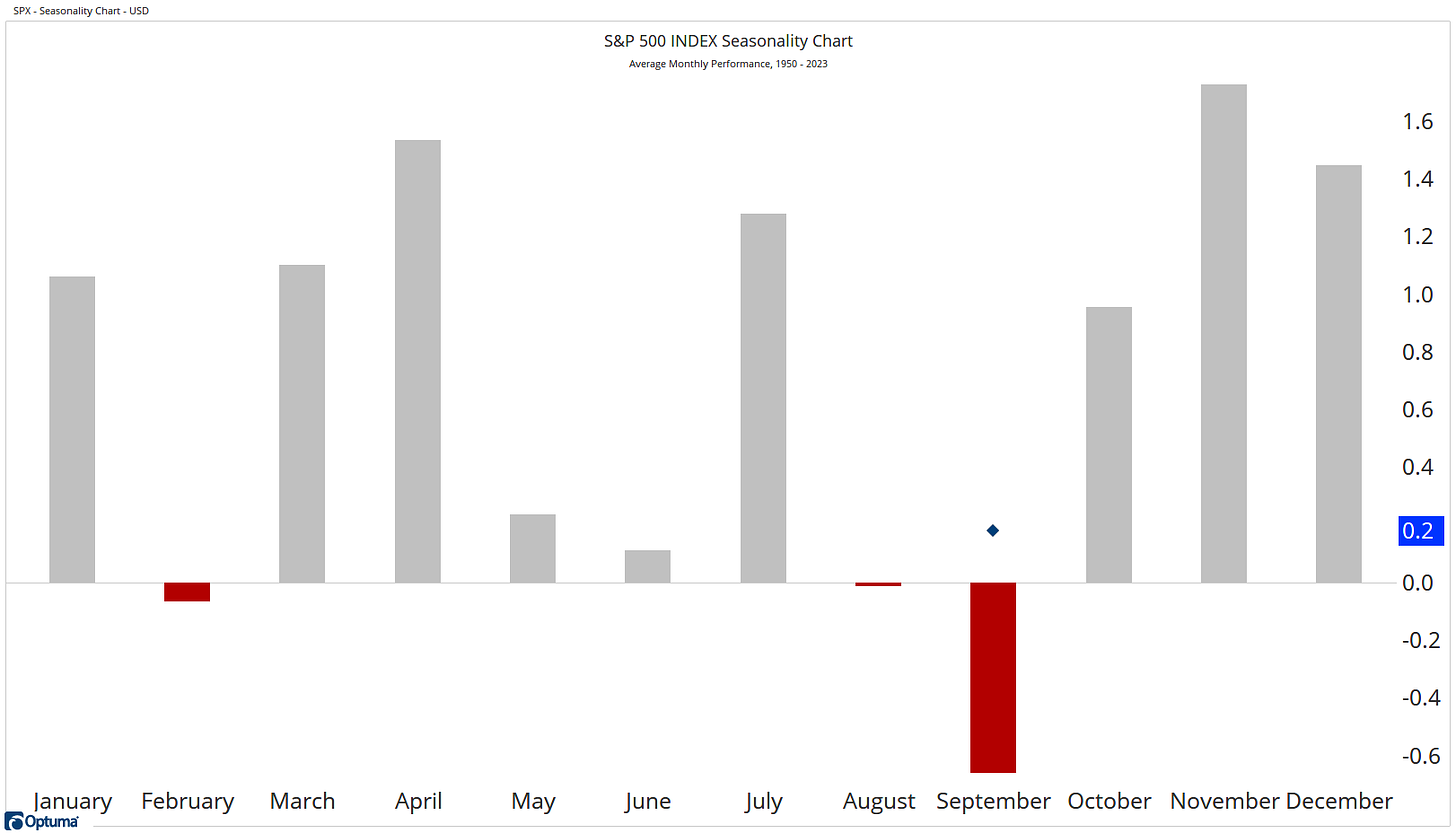
With the expected choppy August and Tech correction firmly in the rear view mirror, the attention now turns to navigating September, a month notorious for market declines.
If you don’t know (I’m assuming most of you do), these are the seasonal numbers for September.
Seasonality Chart (SPX) - Dating Back 70yrs
Betting on seasonal declines EVERY September is a bit like paying too much attention to the technical analysts posting bearish engulfing candles… it’s a losers game, it’s not process driven and it’s detrimental to your wealth.
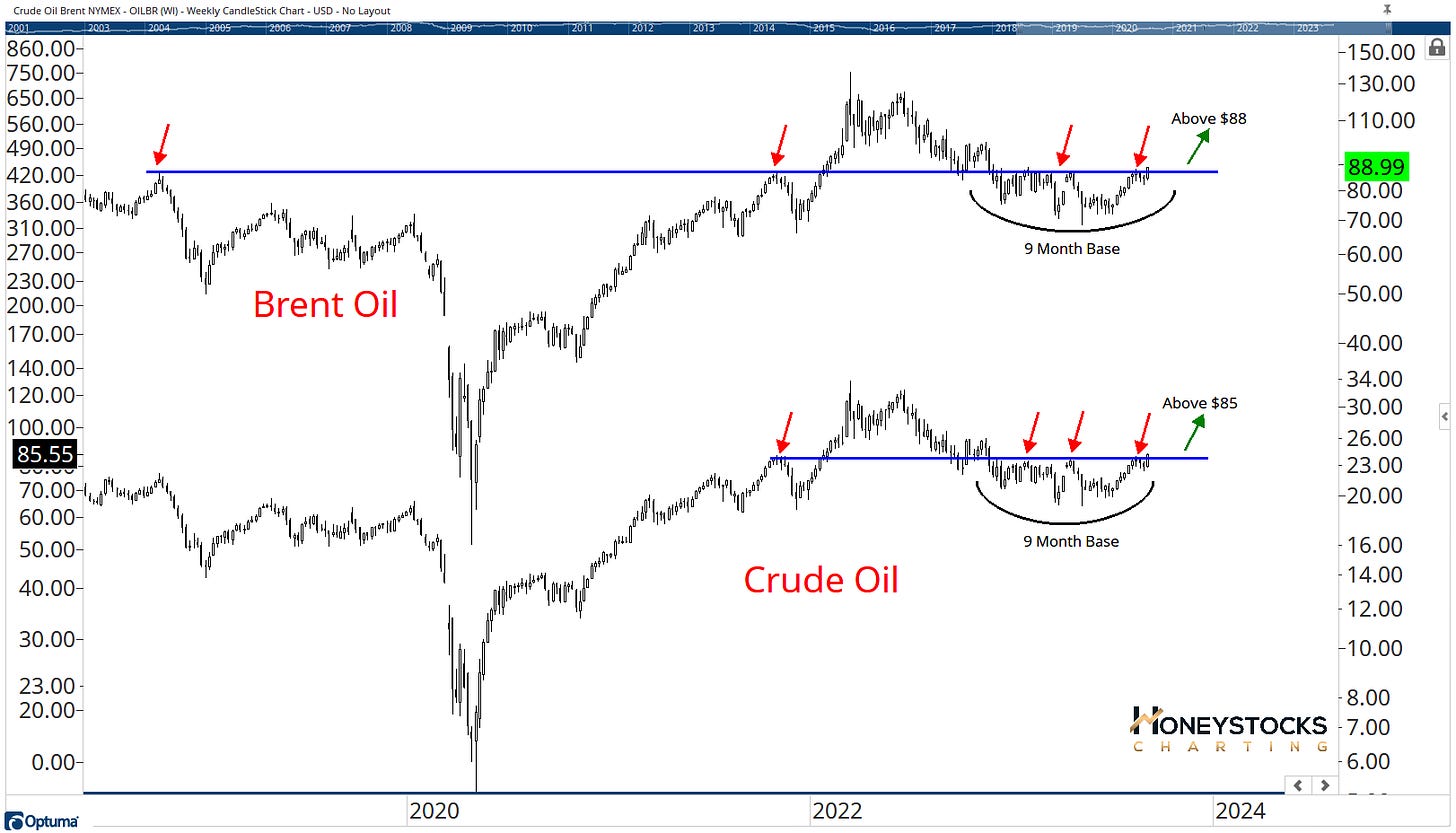
I much prefer assessing each chart on its individual merits, take the Oil Markets for example.
Are we really NOT going to look at energy, just because seasonal charts hint we might decline?
Of course not, that would be dumb. Really really dumb.
Crude & Brent Oil
If you follow my work closely, you’ll already know we’ve been bullish energy names a couple of months now.
I like to find relative strength at its base BEFORE the relative strength gurus start identifying it at its peak.
This month, I’ve laid out a bunch of charts via our YouTube Channel, and as always, I hope you find some value.
Have a great weekend.
Please Note - If you do find value from my work, there’s a link below for access to all of our premium charts and content.
Please do consider forwarding to your friends and subscribing - it’s free.
Click below to access all our best charts and alerts in real-time.


