Before I get into this weeks letter, I’m receiving a lot of requests for more YouTube Analysis videos.
Unfortunately, with my large (and rapidly growing) membership/client base I just don’t have the time to build / prepare / edit / upload etc so those posts are usually once a month when I can find some time (usually when weather is poor).
I will always try to provide as much value in this letter as I can and if you do find value, please share this letter everywhere you can.
It’s free.
Ok, so is the world ending?
If you pay too much attention to Twitter and all the confirmation biased junior economists posting their negativity, there’s a fair to decent chance you’ve missed one of the most hated face ripping rallies I can remember.
I’m half tempted to start a drinking game.
THE ONLY RULE - Take a drink whenever you see the following on Twitter.
“It’s a matter of time”
“Titanic”
“Recession”
“Earnings Decline”
“This won’t end well”
“Mike Wilson”
Bearish Analog chart compared to ANY time period
I don’t think anyone would make it past an hour.
Anyway, I know you’re not here for my sense of humour, so let’s dig into some charts.
S&P500 Index (SPX & SPY)
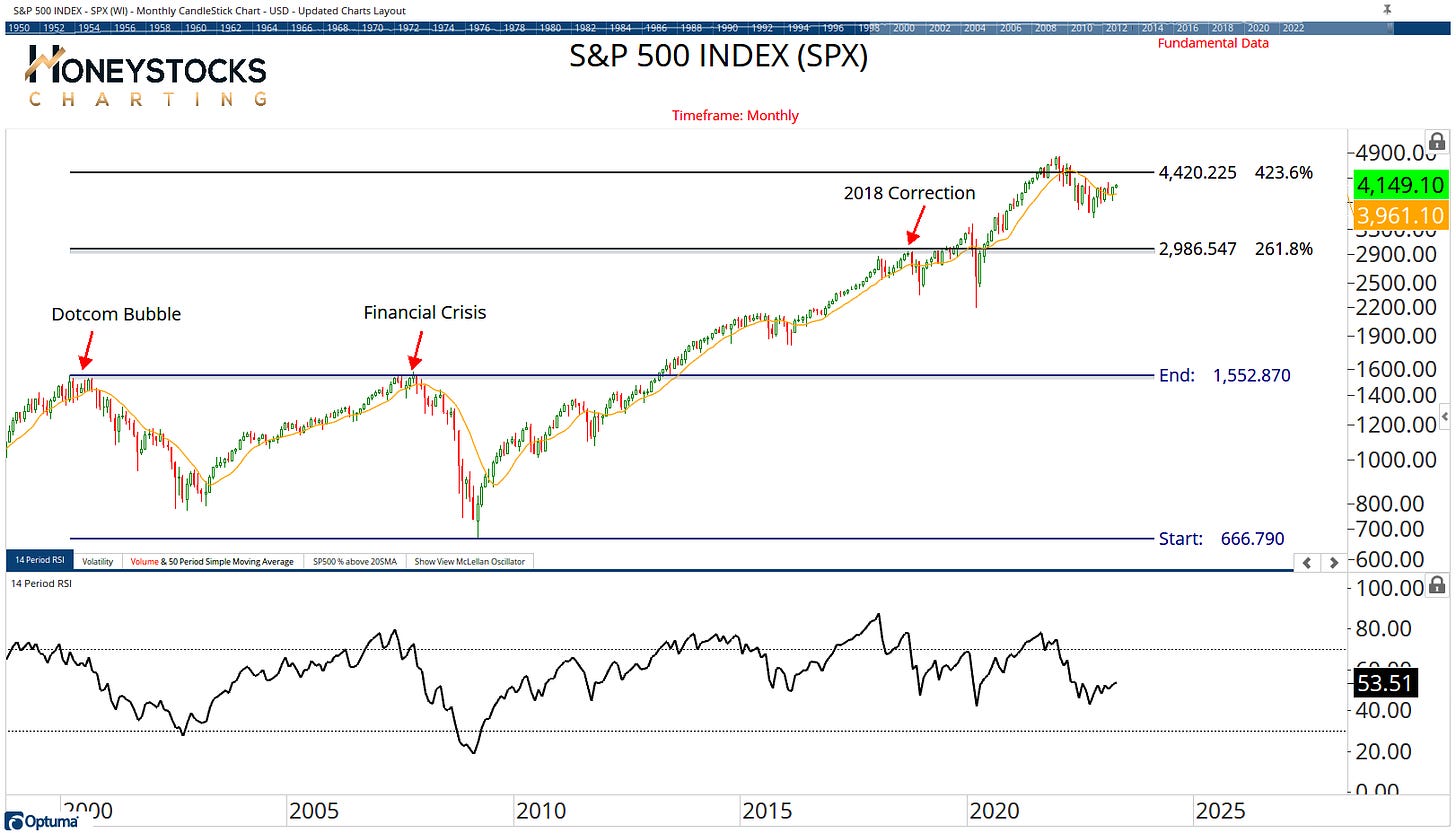
The S&P500 has quietly gone about its thing and is now trading back ABOVE it’s 10 Month Moving Average which history shows is a very good trend following risk on/off signal.
Risk on?
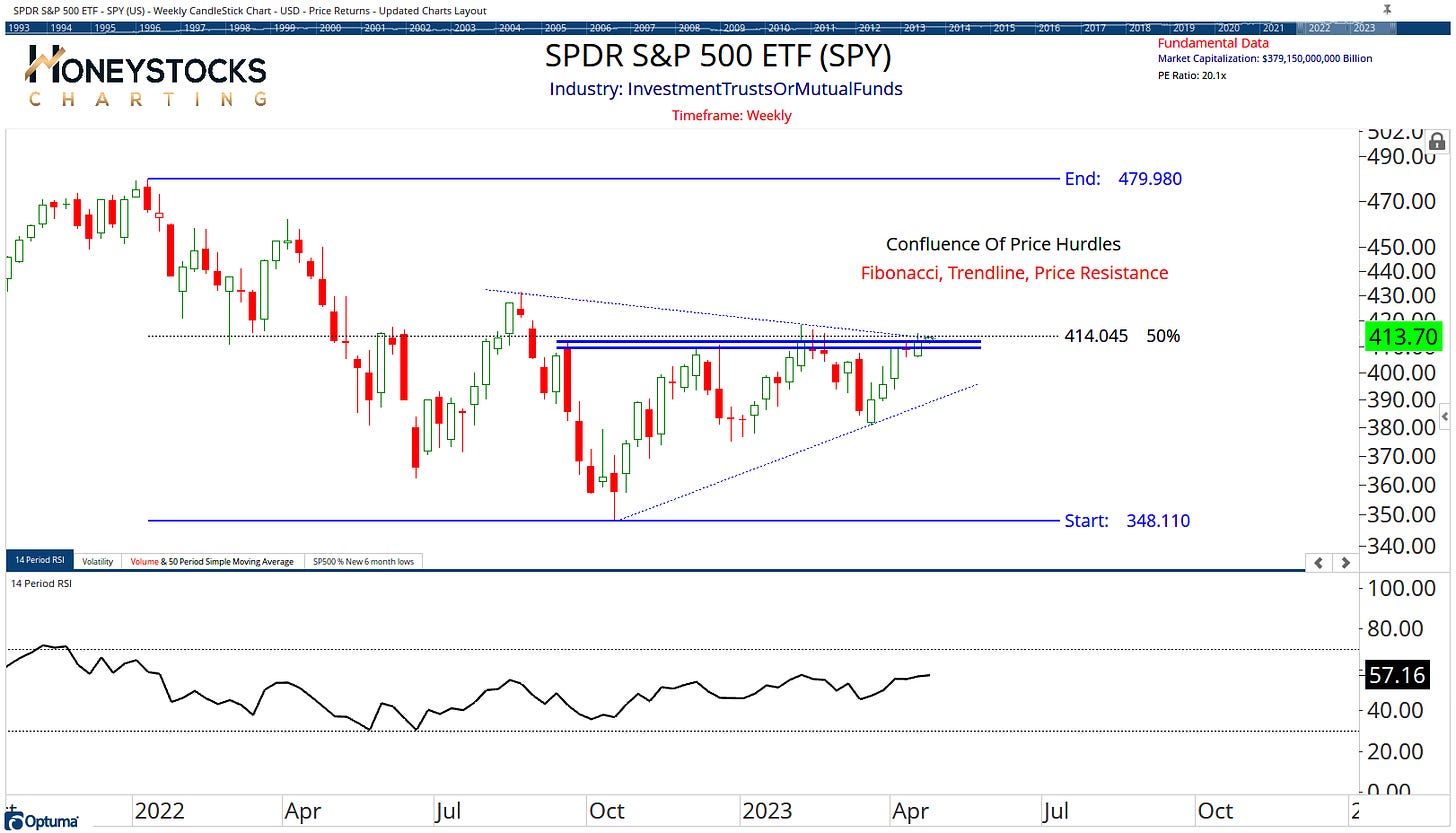
Looking at the shorter term SPY chart, we’re very close to breaking above a confluence of technical price points.
These are levels the doom-mongers are watching closely for market declines, and while I’m always open to every potential outcome (I think we need to be), price (for the moment) is communicating the opposite.
If SPY breaks out, I think there’s a decent chance the market rips higher and follows Europe’s lead.
Much of Europe is testing all time highs if you don’t know.
Berkshire Hathaway (BRK.B)
After 10 months of sideways action, price is now starting to look constructive for a potential break out.
It’s a weekly chart, so it’s not confirmed (yet), but if the S&P500 is going to break out, you have to think Berkshire goes with it.
Does anyone see it differently?
US Dollar Index
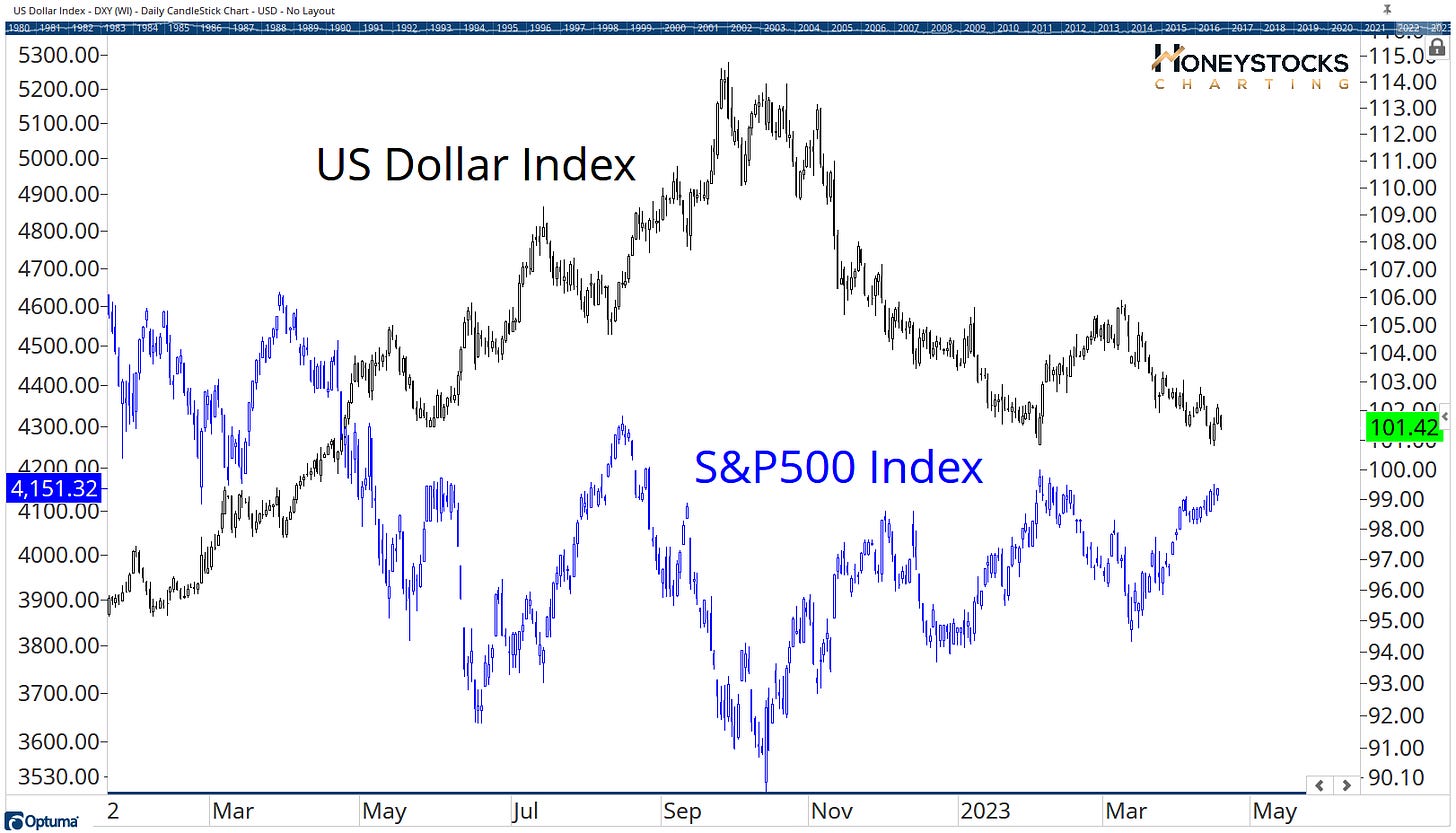
If you’ve followed my work for more than 5mins, you’ll know I’ve presented this chart a hundred times over the last 12 months, and it still amazes me very few talk about it given the clear inverse correlation with US stocks.
The US Dollar is STILL driving everything… the big question is - what happens if this trend continues lower… what would that mean for stocks?
Our ETF Chart Books
If you also follow my work on Twitter, you’ll know I’ve been harping on quite a bit about my buy low : sell high charts.
Lets assess some charts from our ETF Chart Books which cover 100+ of the most liquid ETF’s from around the world, including all the major sectors and countries
They’re accessible daily.
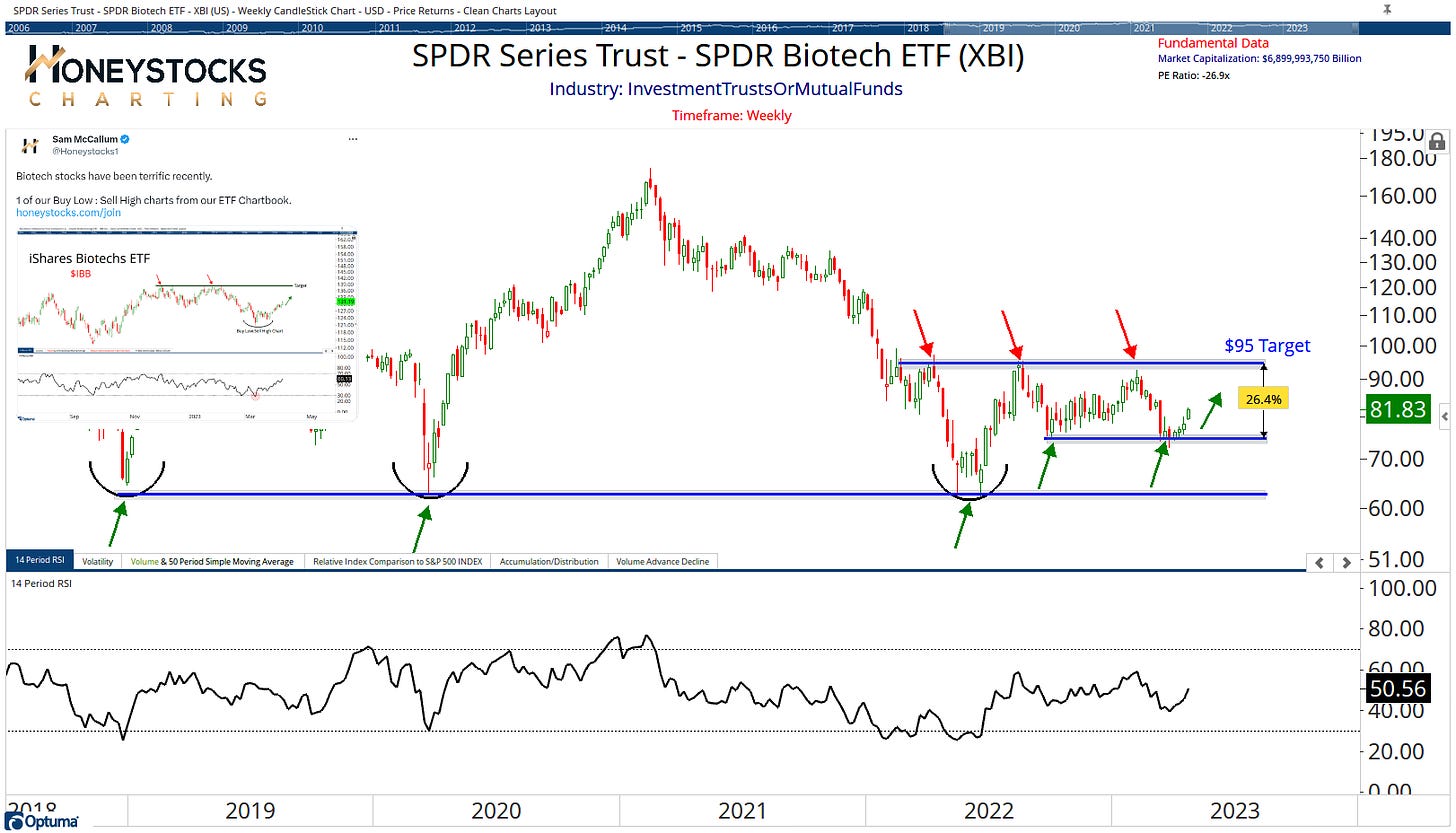
Biotech’s (XBI)
Our premium work has been bullish on Biotech’s a few weeks now and they’ve been working very well with XBI moving 4.5% yesterday alone.
I have a $95 Target after recommending to clients/members at $75.
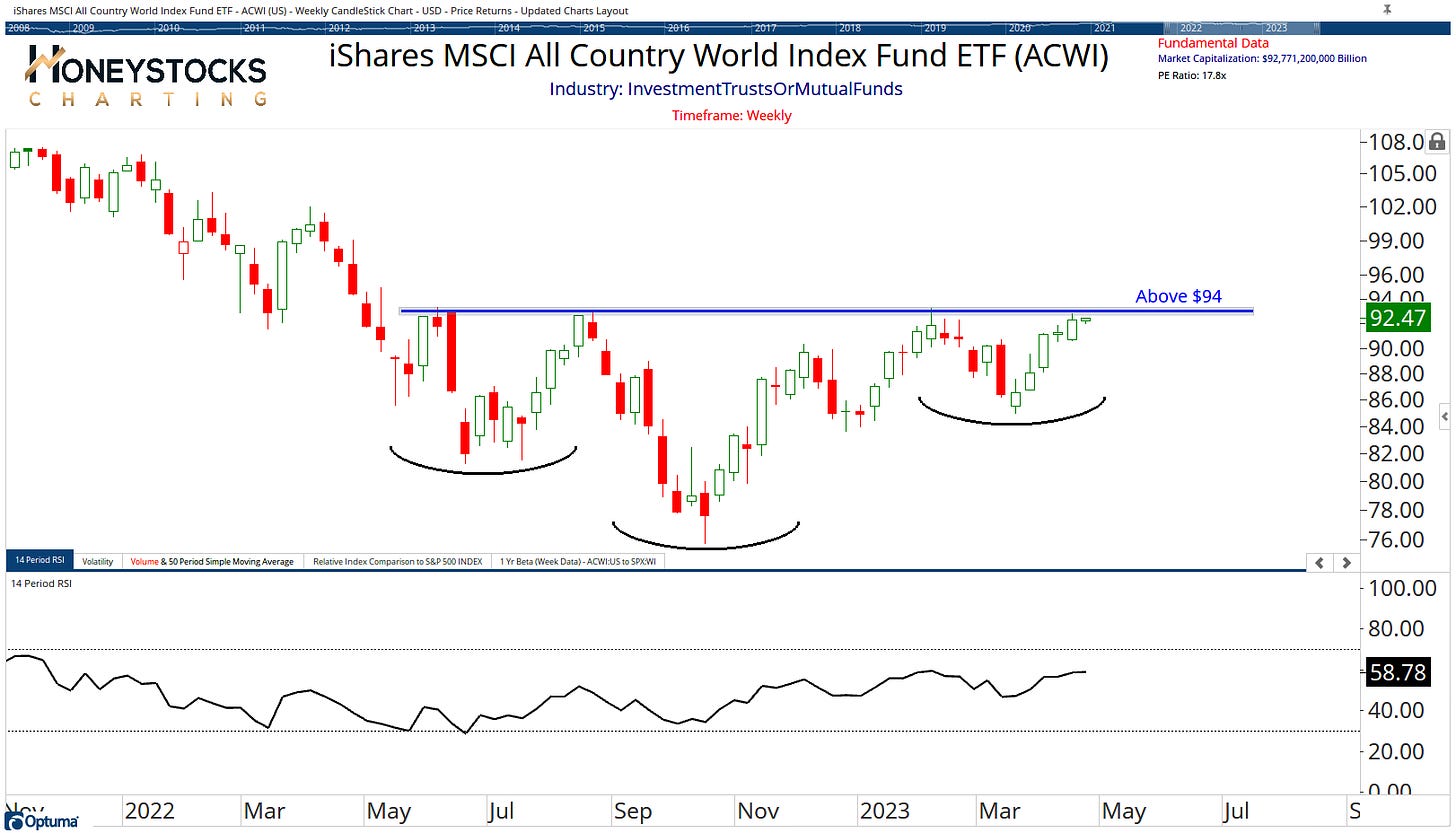
All Country World Index (ACWI)
Very obvious technical setup developing, and with stock markets around the world pushing higher, it makes sense to add ACWI to the watchlists.
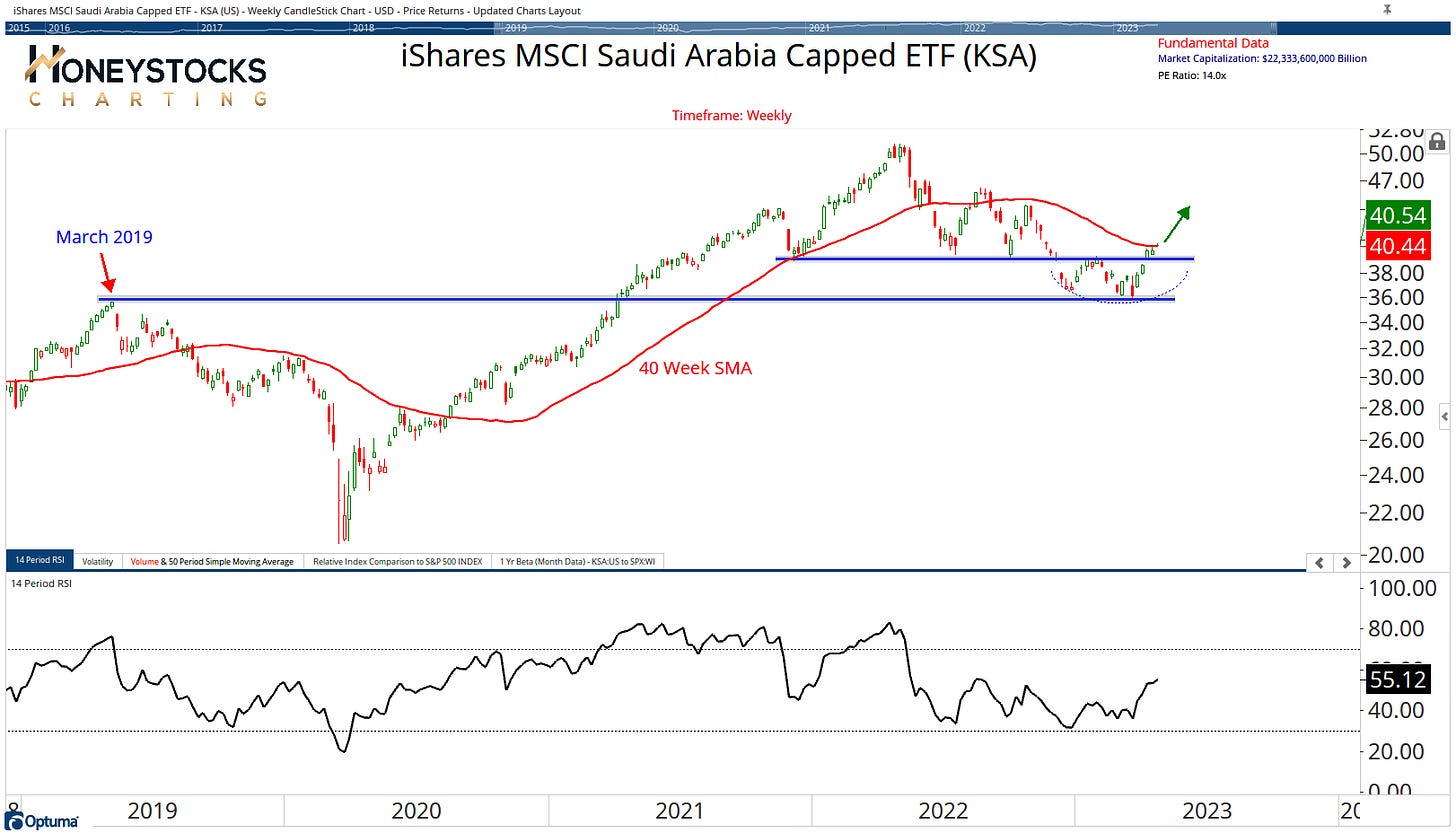
Saudi Arabia (KSA)
Saudi looks to be putting in a constructive move after rebounding from logical price support levels a few weeks ago.
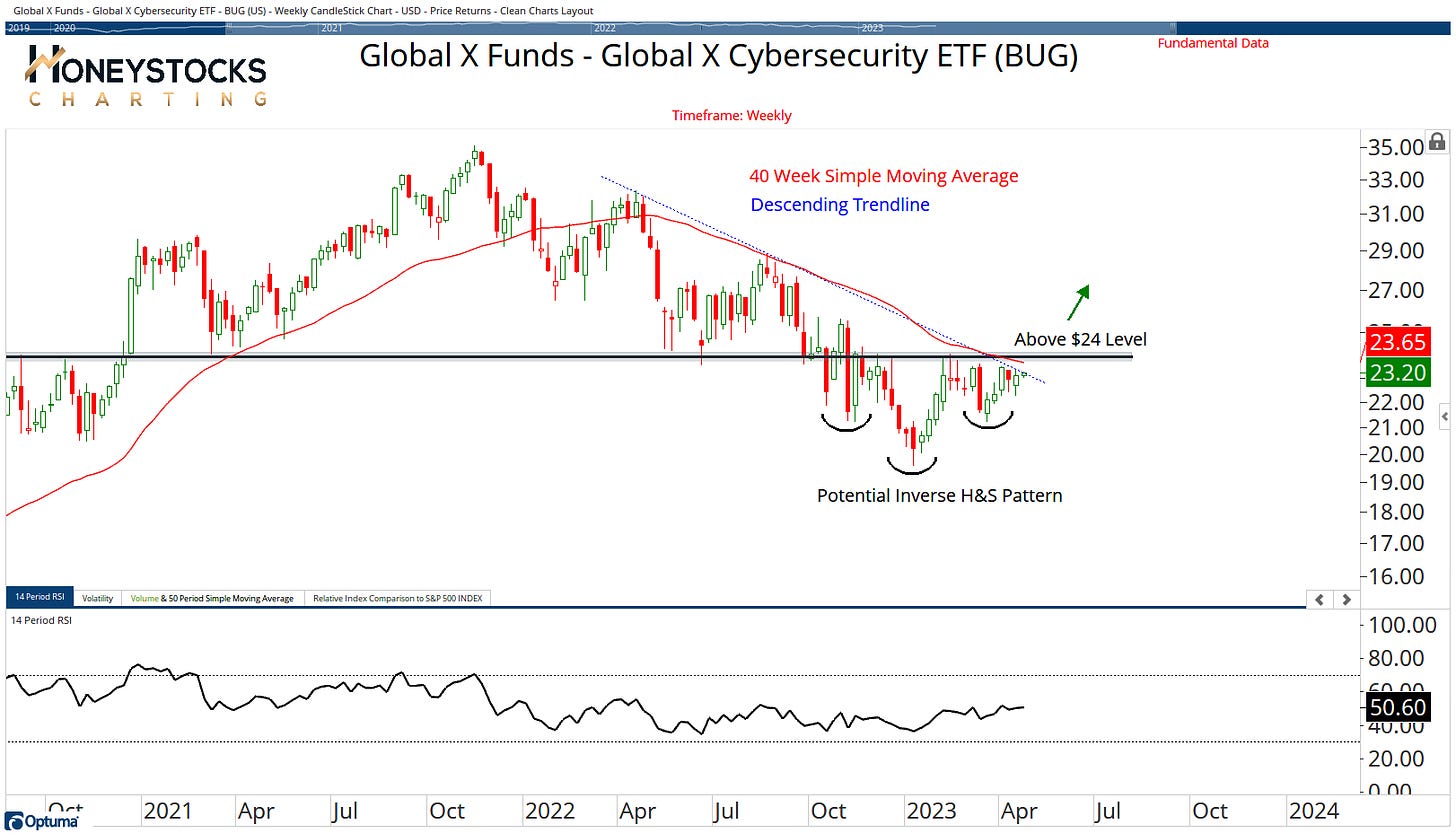
Cybersecurity (BUG)
Again, another 1 of those charts with a confluence of price hurdles and a basing pattern… if we move above that $24 level, don’t be surprised to see cyber stocks rip higher.
In Conclusion
There’s something for everyone.
If you’re bearish, you can find areas / stocks to short and if you’re bullish there’s no shortage of risk : reward propositions.
I’m quite happy to let the perma-bears continue missing out, because I know short positions will need to get covered on a market break out and they’ll need to buy stocks to offset large losses, and in my world, that’s bullish for stocks, not bearish.
Earnings Season will be the typical rocky hike uphill, but it always is. So nothing changes for me.
I know the market levels to get defensive and I know how to manage risk.
How do you see things playing out?
Please do consider Subscribing and Sharing with like-minded folks. It’s free.
Access our premium analysis and chart books by checking our Premium Membership Options below.


