Welcome back to my dumb little weekly letter.
I want to get into a few important charts and trade ideas this week, but first, I’d like to kick things off by breaking down the bearish narrative.
Despite what some of the biggest and brightest analysts in the world will have you believe, it’s been a rampant bull market for the last 18 months and the folks who’ve missed it all, just can’t bring themselves to buy stocks at elevated levels, so naturally they’re calling for crashes and corrections.
More recently, I’ve also observed some of the biggest CMT’s in the world recklessly advocate front running a bearish phase and begin shorting the market because of poor market breadth, bearish February seasonality and small caps aren’t above their December highs.
My thoughts are pretty straight-forward, these folks are living in cloud cuckoo land.
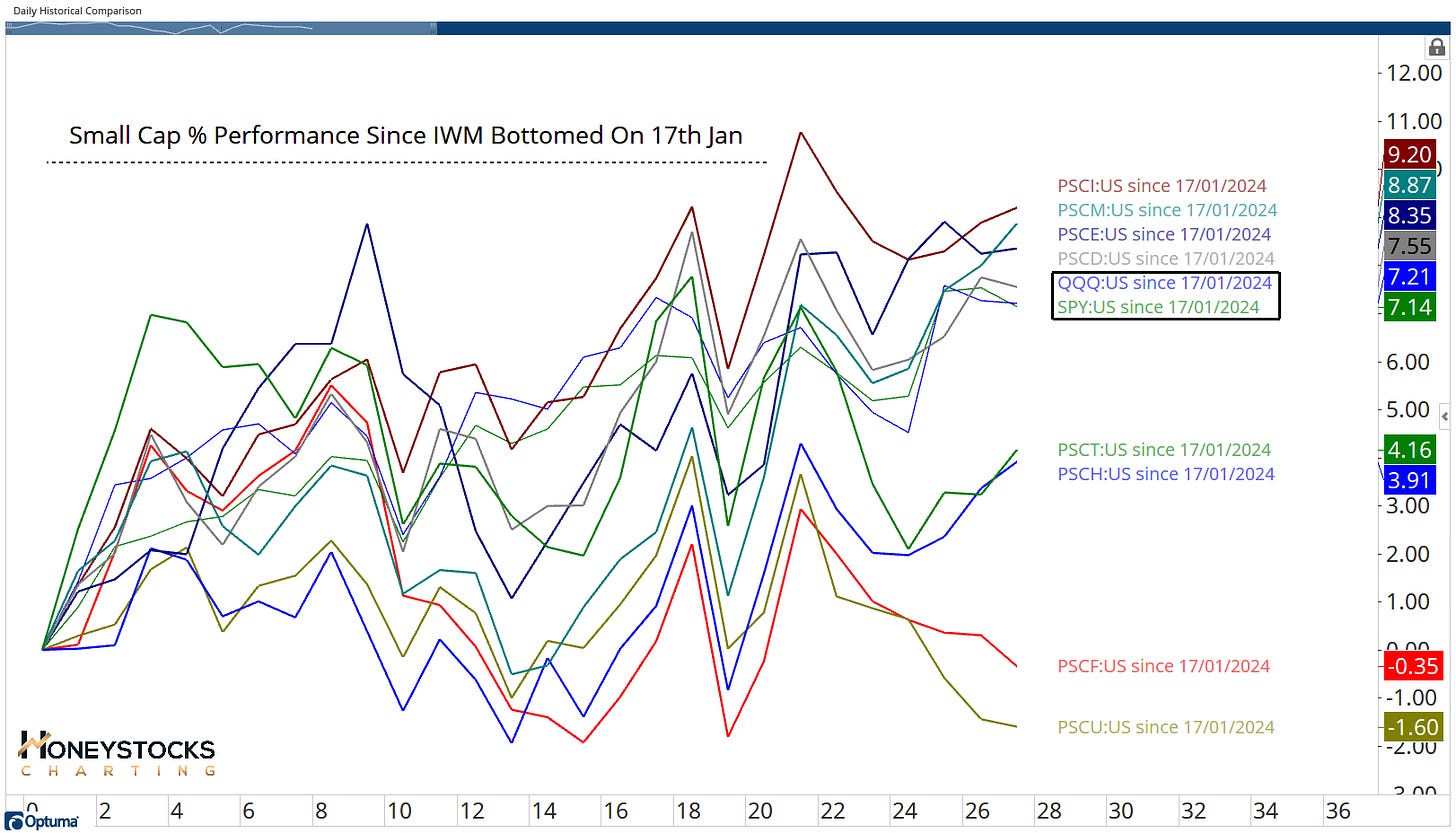
So anyway, we’re here for charts and data, and since I prefer to focus on the now, rather than waiting for stocks to break out to new highs, here a few numbers since the small caps bottomed on the 17th Jan,
As we can see, we have 4/8 small cap sectors currently out-performing both the S&P500 and the Q’s.
Current Small Cap Performance
If you already subscribe to our premium work, this letter is automatically included in your membership so please drop me a message on Workplace with your email address.
Keep reading with a 7-day free trial
Subscribe to The Weekly Grind to keep reading this post and get 7 days of free access to the full post archives.


