If you find value from my hard work below, please do consider sharing/subscribing and also following me on Twitter where I also post lots of useful charts and data.
Lets not beat about the bush.
After an almighty rally off the October lows, the US markets are now starting to range and get quite messy.
It’s been that way a few weeks now.
Break outs are failing, stocks are breaking down and everyone’s wondering if this is the start of something bigger to the down side.
As far as I can tell, the bearish thesis centre’s around an inverted Yield Curve and a recession, but rather than try to time something that might take another 12 months to play out, I’ll continue to identify the areas of the market showing strength / weakness.
So with all that in mind, lets get into a few charts from our chart books.
Sugar
CANE ETF
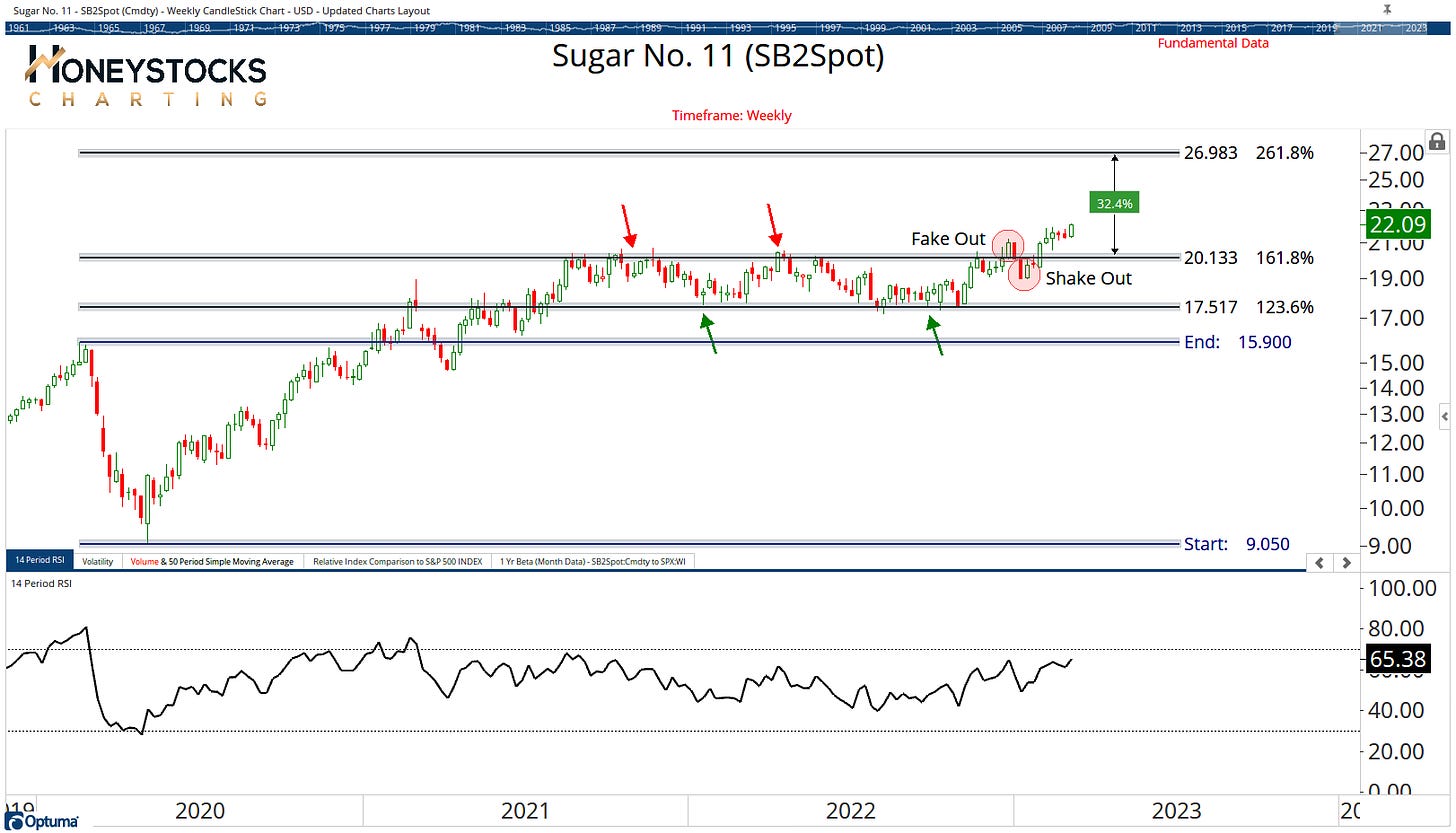
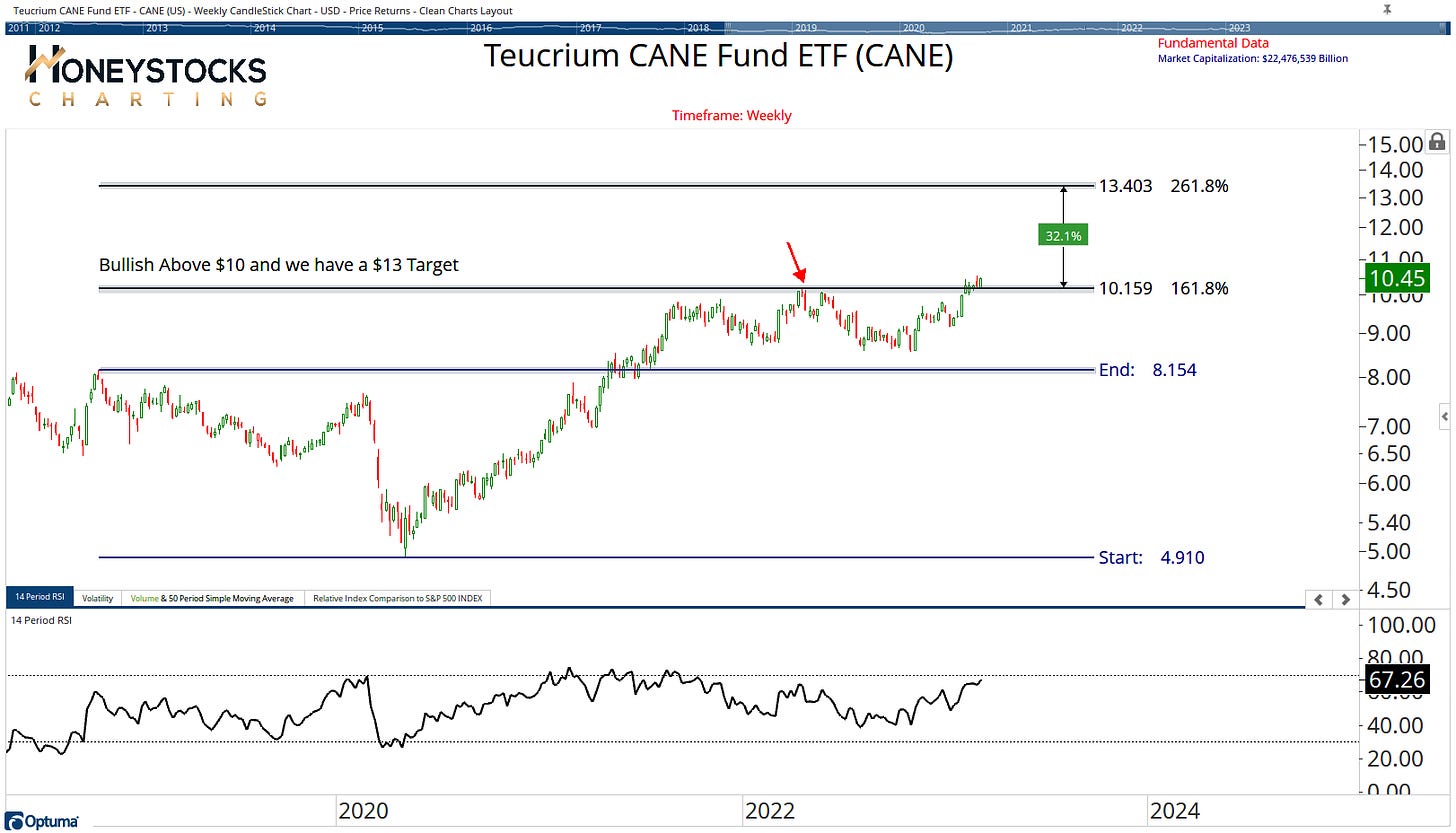
Sugar likely isn’t front and centre for many of you reading, but some of the commodity charts are looking constructive.
It’s been 1 of our recent commodity picks for our members and the CANE ETF is easy to define risk at these levels. Bullish Above $10… not so bullish below.
Natural Gas
Natural Gas (UNG)
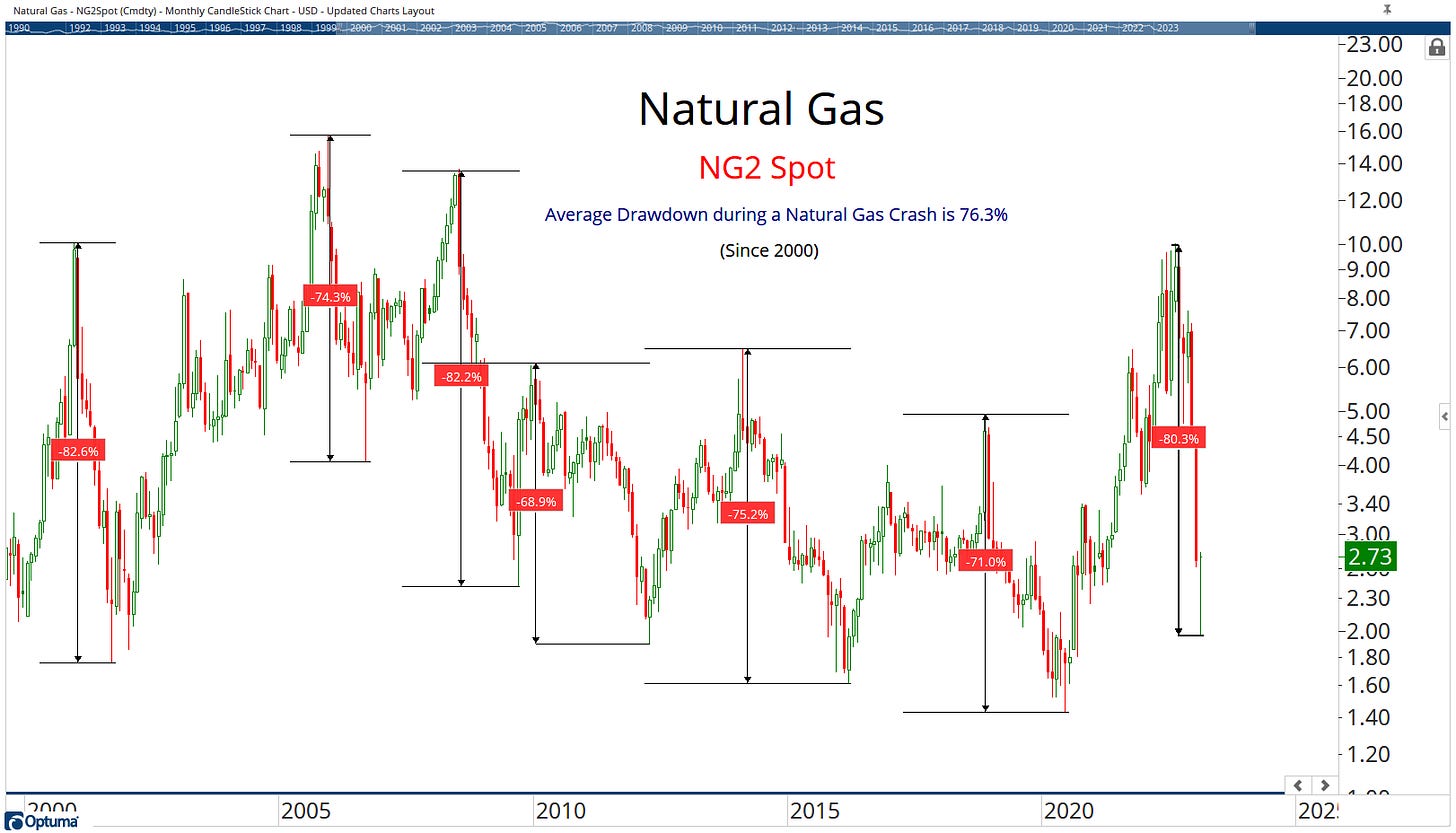
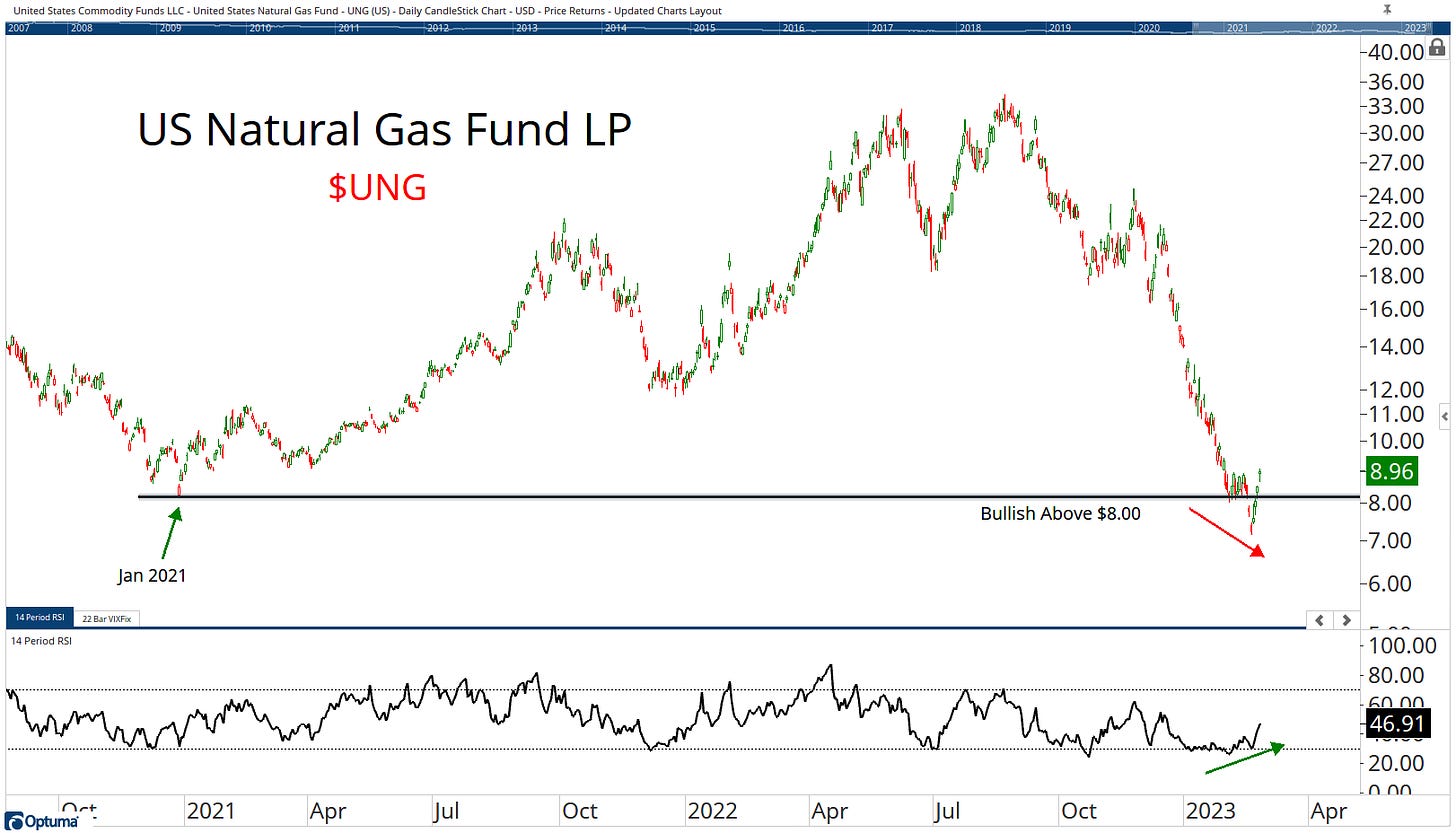
Everyone and their dog has been trying to time the bottom of Natural Gas for months now, and if you follow my Twitter, you’ll know I posted a chart a couple of weeks ago highlighting the DeMark indicator signalling that we were getting close to a tradeable bottom.
Add in that we’ve reached a % decline level that’s comparable with historical declines, the appeal is there.
I like anything where we can define risk, especially in a HIGHLY volatile area of the market like Natty Gas… if we’re above $8, I don’t see the problem being long, even if it’s just a shorter term mean reversal.
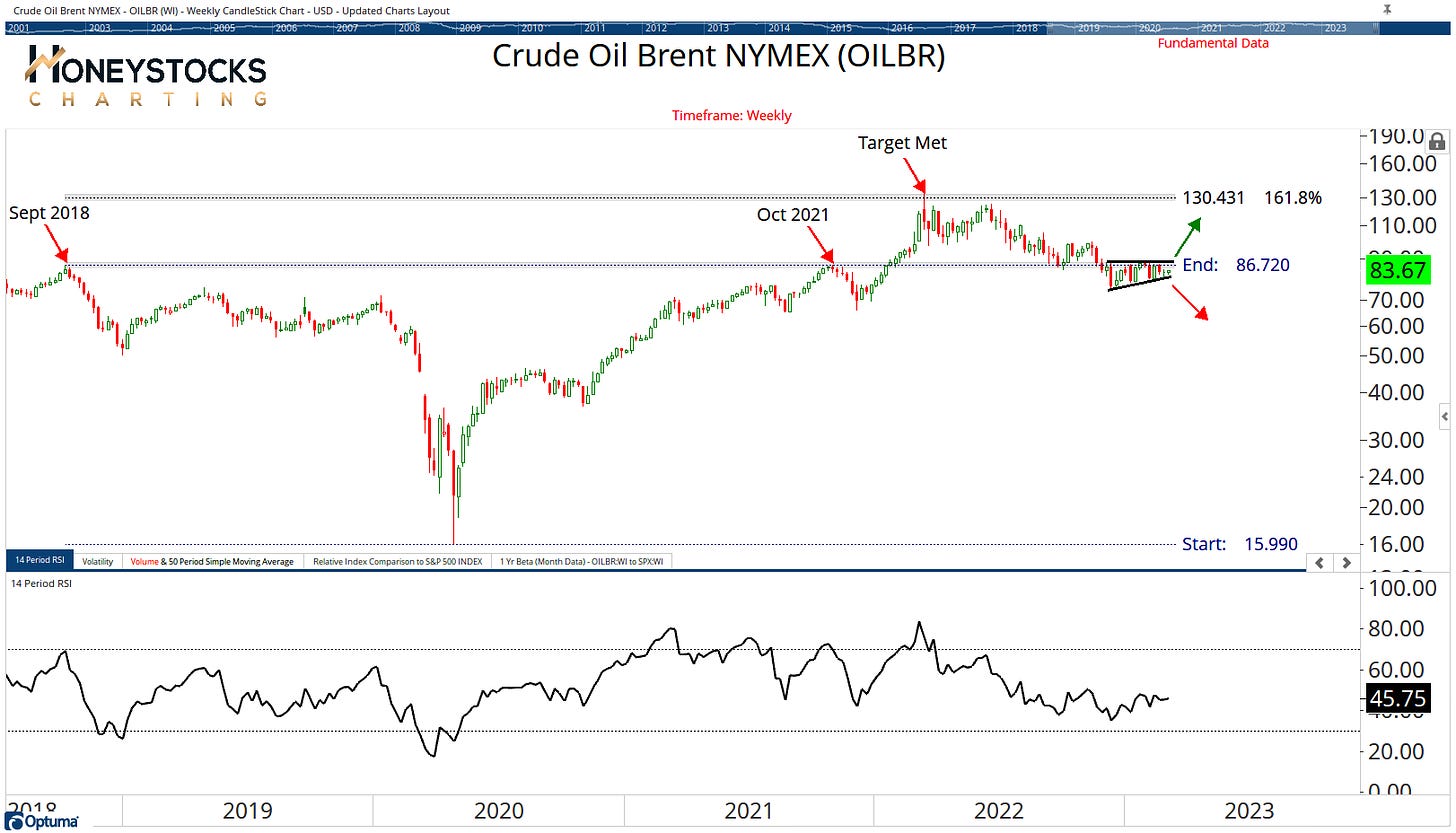
Oil / Energy Markets
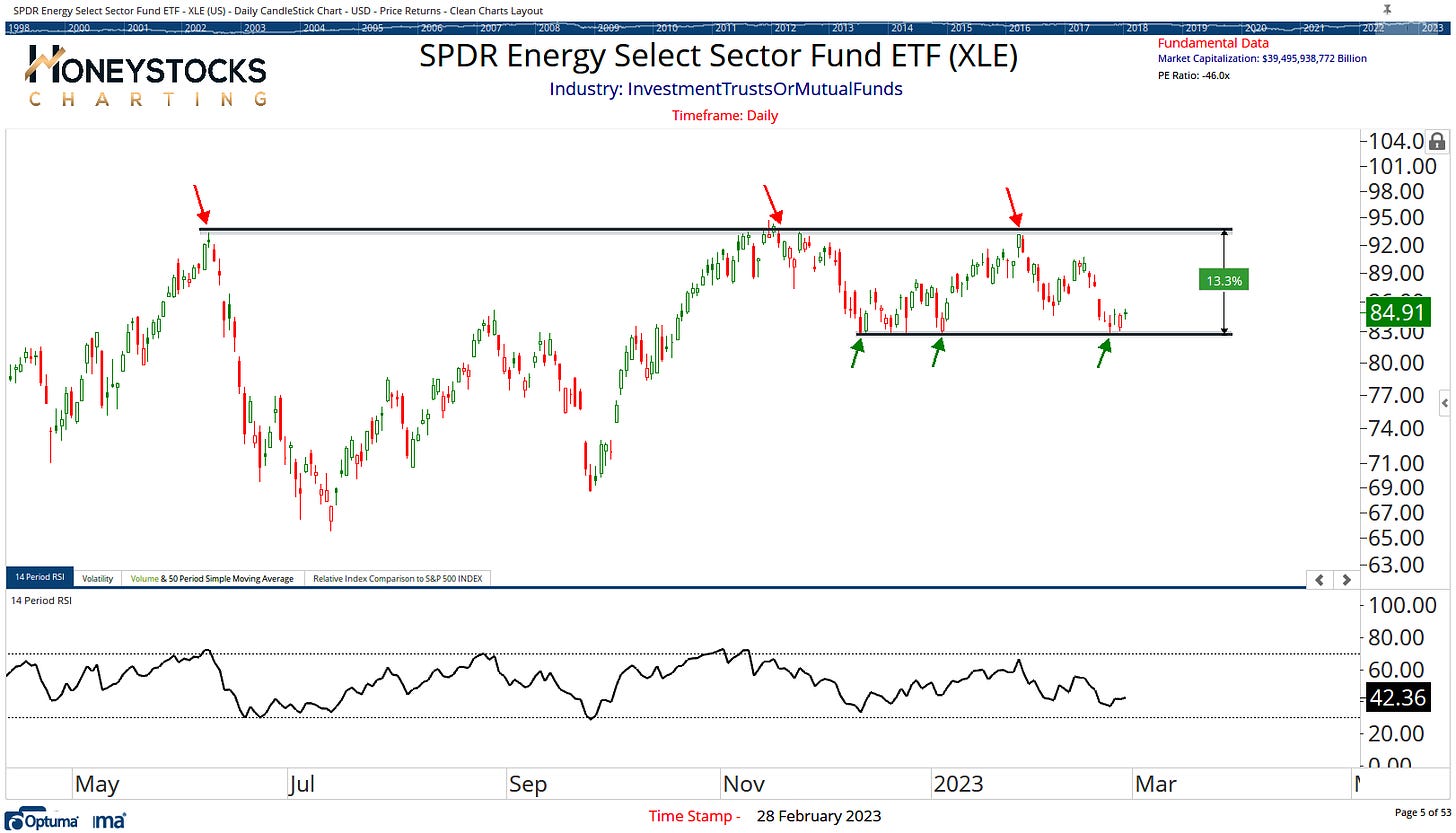
SPDR Energy ETF (XLE)
The energy markets are chopping sideways just now, and in a sideways market, it’s very simple for me and my work.
Technical price support levels, easy to define risk, buy low/sell high at clearly defined price levels.
In Conclusion
All the above charts are taken directly from two of our members accessible chart books.
The ETF Chart Book
The Commodities Chart Book
It’s slim pickings for new entries in stocks at the moment, unless you’re a momentum trader holding on for dear life every afternoon trading crap stocks being pumped on Stocktwits or Reddit, there’s not much quality around for technical setups.
We’re coming into a seasonally strong period (March and April) but that’s just 1 data point, nothing with seasonality is a guarantee.
In the meantime, I’ll continue to watch my charts, because I trust my charts more than I trust the absolute nonsense on CNBC and Bloomberg.
Let me know what you think.
Please do consider Subscribing and Sharing with like-minded folks. It’s free.
Alternatively, feel free to check out all our Premium Membership Options below.


