Before I sat down to write this weeks letter, for the first time in a minute, I’ve struggled with what to say because I’ve already communicated my views quite well over the last 2 weeks.
If you missed those letters, I’ve linked them below. They set the scene well.
It’s been a challenging start to August at the index level, the numbers tell us that, and with the news that Michael Burry’s monumentally shorting the market again to the tune of $1.9B in puts, everyone’s wondering what comes next.
Month to Date Numbers
There’s nothing really unexpected with the August numbers so far, but lets start by taking a look at Oil / Energy, because it’s an area that’s getting lots of airtime just now.
Brent / Crude Oil
To be clear, we’ve been bullish oil and many energy names for a couple of months now.
The concern I have is we’re now starting to see lots of air time with many of the relative strength folks banging the drum despite Oil already being 30% off its lows.
It’s a contrarian thing for me.
To have high conviction in NEW energy positions, I’d like to see the oil markets break out as per the chart, below that, it’s probably a choppy/risk management game.
“If you don’t already know my views on relative strength, I take the view by the time the names show up on relative strength scans, you’ve already missed the bulk of the move”
This view goes against most professional technical analysts / CMT’s I know, but I’m ok with that.
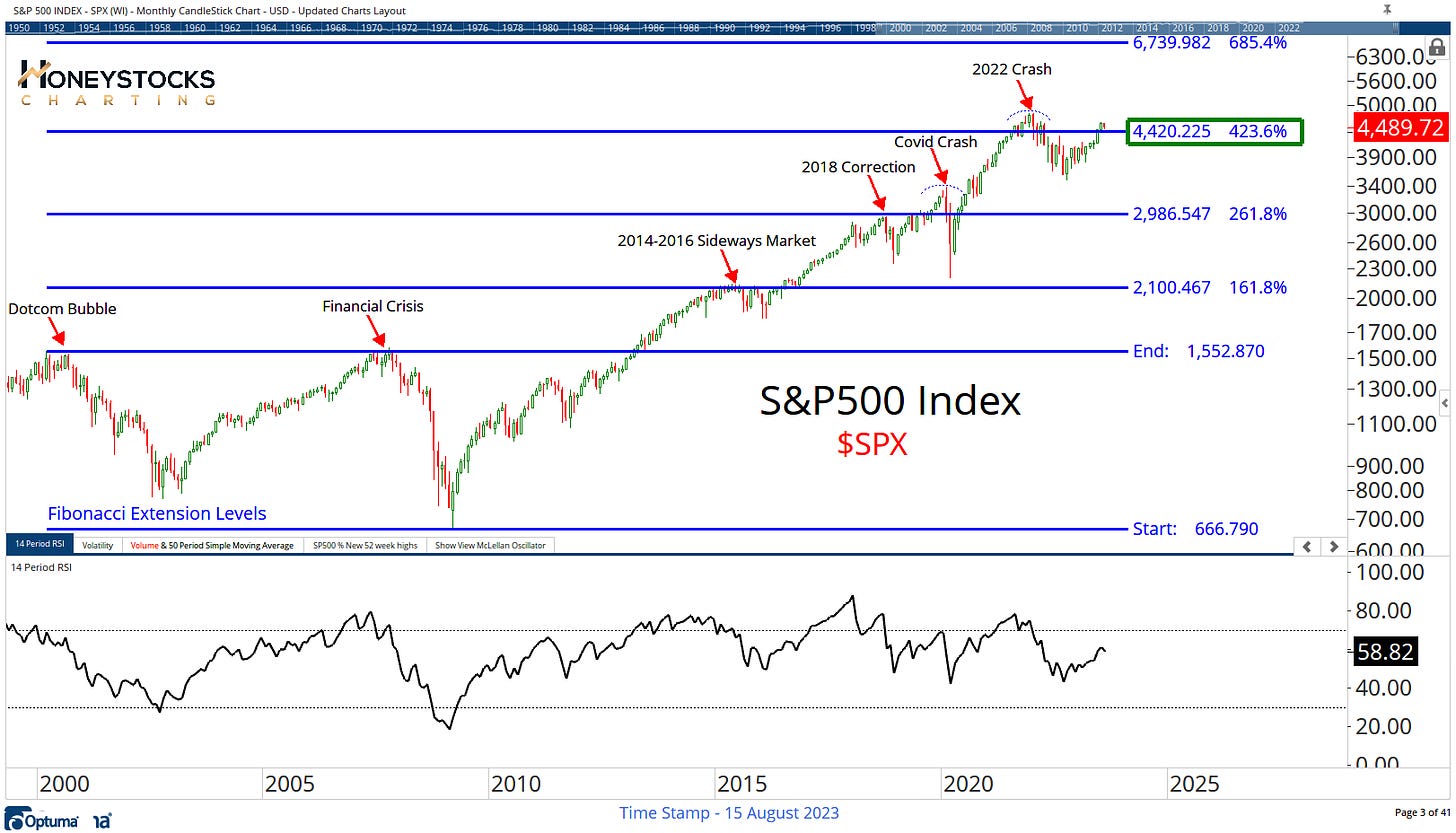
S&P500 Index (SPX)
The S&P500 and the broader US Market has been under pressure over the last couple of weeks.
As the chart above shows, provided we’re still above that 4400 level, the world probably isn’t ending as much as Burry would have you believe.
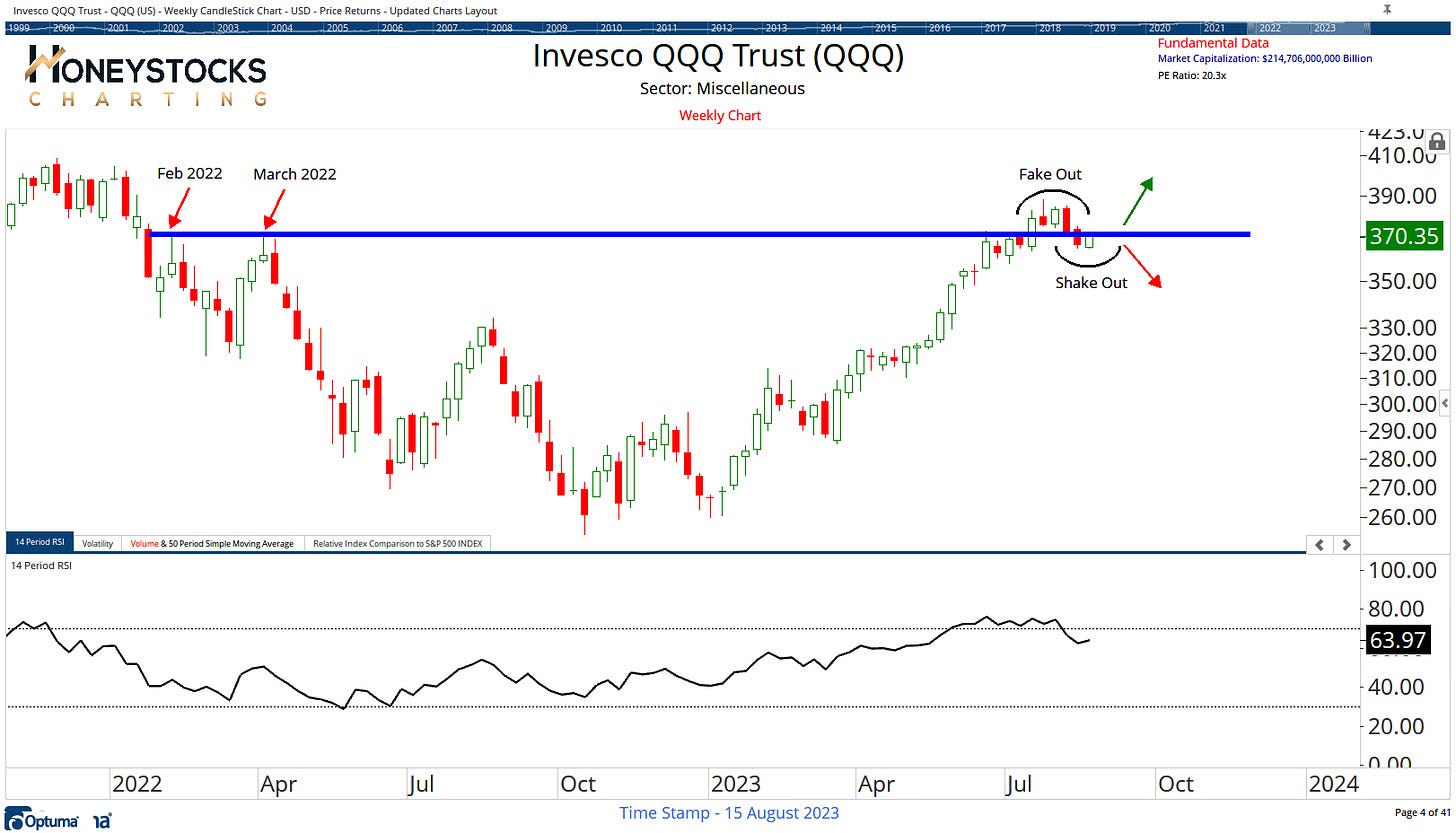
Invesco QQQ ETF
As I’m sure everyone’s noticed, tech stocks decided cliff jumping was a new hobby to take up recently, and while the Q’s aren’t the best representation of technology stocks (they make up only 55% of the Index), everyone and their dog is wondering if the dip can get bought up.
I’m wondering the same thing myself, and the directional resolution of this chart will help with those decisions.
Bearish retest, or shake out? Let price tell us is how I learned it.
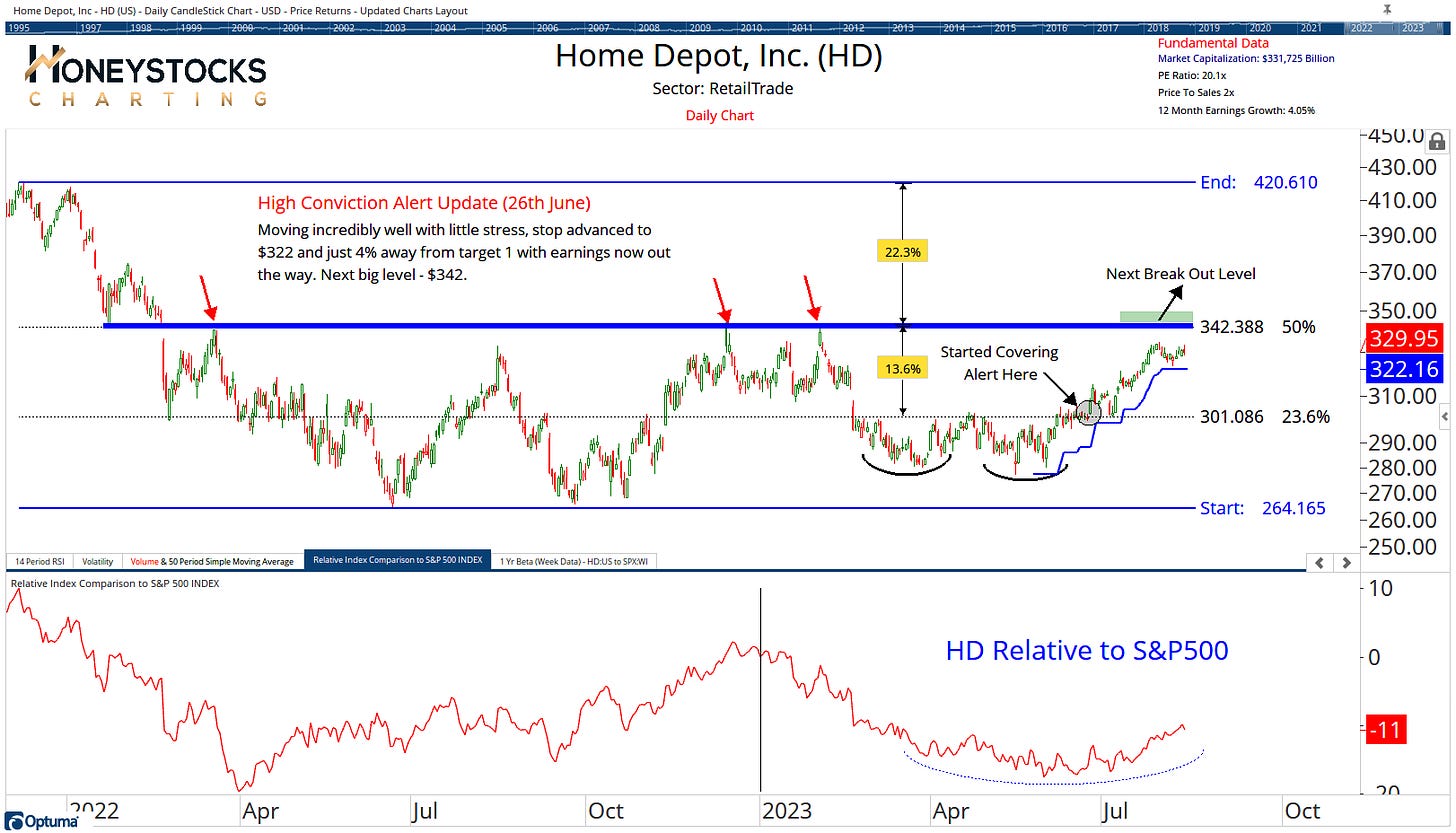
Home Depot (HD)
As I write this, HD just reported earnings, which is a big deal for us because it’s 1 of our open high conviction ideas which has been out-performing the S&P500 since 26th June.
Earnings looked good and beat headline numbers with a $15B Share buy back thrown in, but we’ll see today whether it’s enough to take the stock higher or whether it gets massacred and triggers stops.
$342 is the next big level and a break out above and it’s possibly game on for new positions.
In Conclusion
It’s getting very sloppy and very messy across the market. Not just in the US, but across the world.
It’s just the August/September churn at play.
Michael Burry is getting all the air time on Twitter, but lets also not forget that he gets it badly badly wrong with timing his big market calls 99% of the time.
He’s also predicted 83 of the last 3 crashes and I give it a week before he’s deleted his Twitter again. You can’t make investment decisions based on his doomsday predictions. You just can’t.
That said, if you want to aggressively jump into a choppy market environment, your stock selection game better be on point.
I personally watched about 5mins of yesterdays price action, and suspect it’s going to be the same for the rest of the week. I have no need to take positions every day, I’d rather enjoy the sunshine and the Edinburgh Festival.
Have a great week folks and please do forward to your friends if you enjoyed the read.
Click below to access all our premium work and charts in real-time.


