It’s been a while since I had the time to sit and write something down on Substack, but since the rain is lashing down and I’ve got some motivation, so I thought why not put a few charts out into the world?
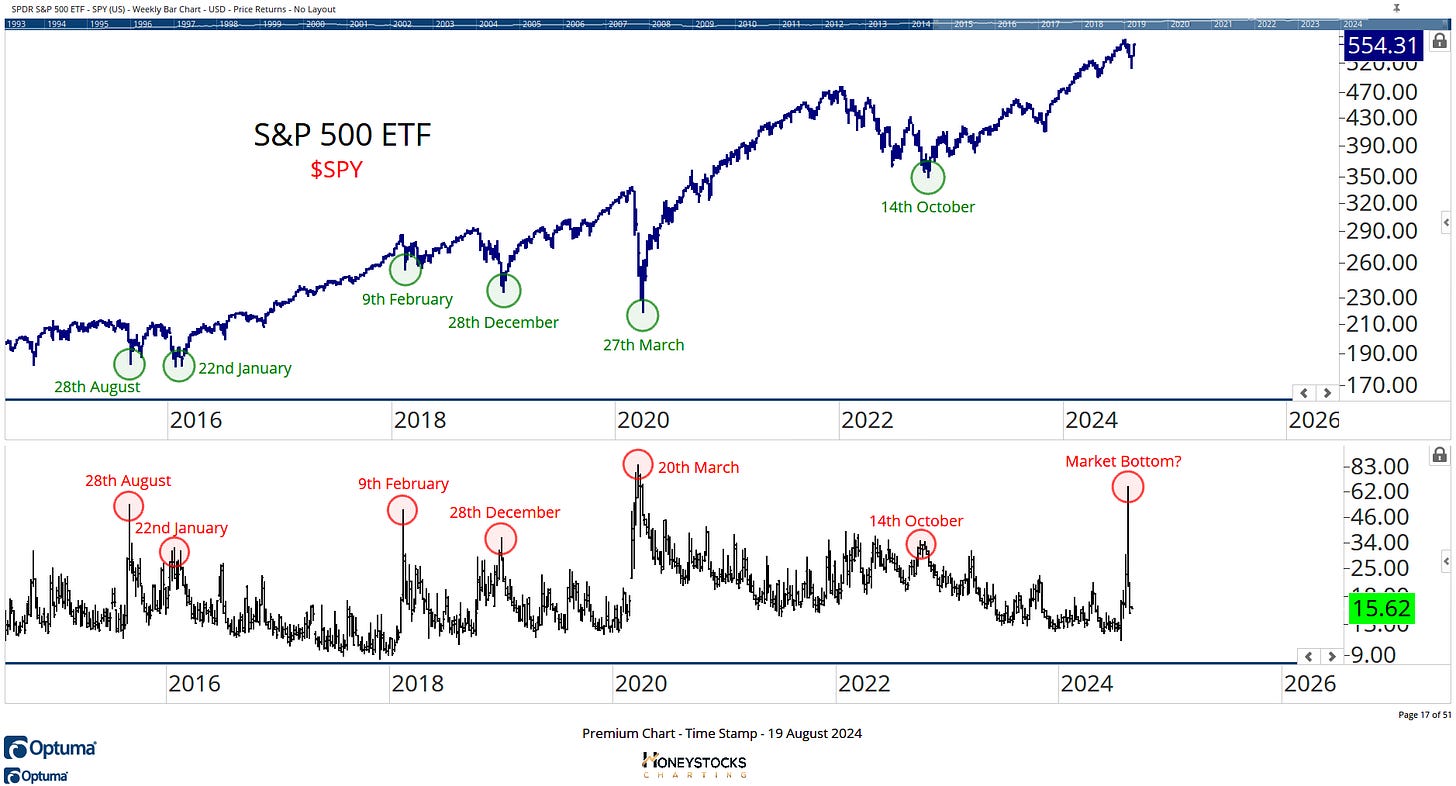
So lets start by talking about this VIX spike, because I see lots of hot takes across FinTwit and lots of Hindsight Harry’s, so I want to kick things it off with THE chart of the moment.
S&P500 (SPY) / Volatilty Index (VIX)
(Real Time) Premium Chart (5th Aug)
For those not aware, the VIX ripping higher beyond traditional spike levels is historically a terrific buy signal for the market.
When the market opened on the morning of the 5th August, I had a lot of clients / members asking what the charts were signalling.
I hurriedly produced the chart directly above.
Turns out this chart marked the EXACT bottom in the market and within 24hrs, it was a case of finding the best discounts on offer.
With the VIX now back down in the 15s, this is an environment where buying stocks makes a lot of sense.
NYSE Composite (NYA)
It’s worth saying that it only taken 10 days, and the NYSE Composite just went out at closing weekly all time highs.
Not bad for the bear market everybody’s been telling the VIX was signalling.
S&P500 ETF (SPY)
The S&P is also getting back to those previous all time highs.
We’re now just a couple of percent away, but just like last time we got up here, I’d probably expect a little market chop.
That for me would be perfectly normal.
Invesco QQQ Trust (QQQ)
If you missed my letter on the 7th July highlighting the target levels in tech, hopefully that helped you bypass most of the recent carnage, but like all corrections and negative headlines, opportunity is always on the other side.
The QQQ chart looks almost identical to the S&P500 and it looks like a pretty text book correction / shake out.
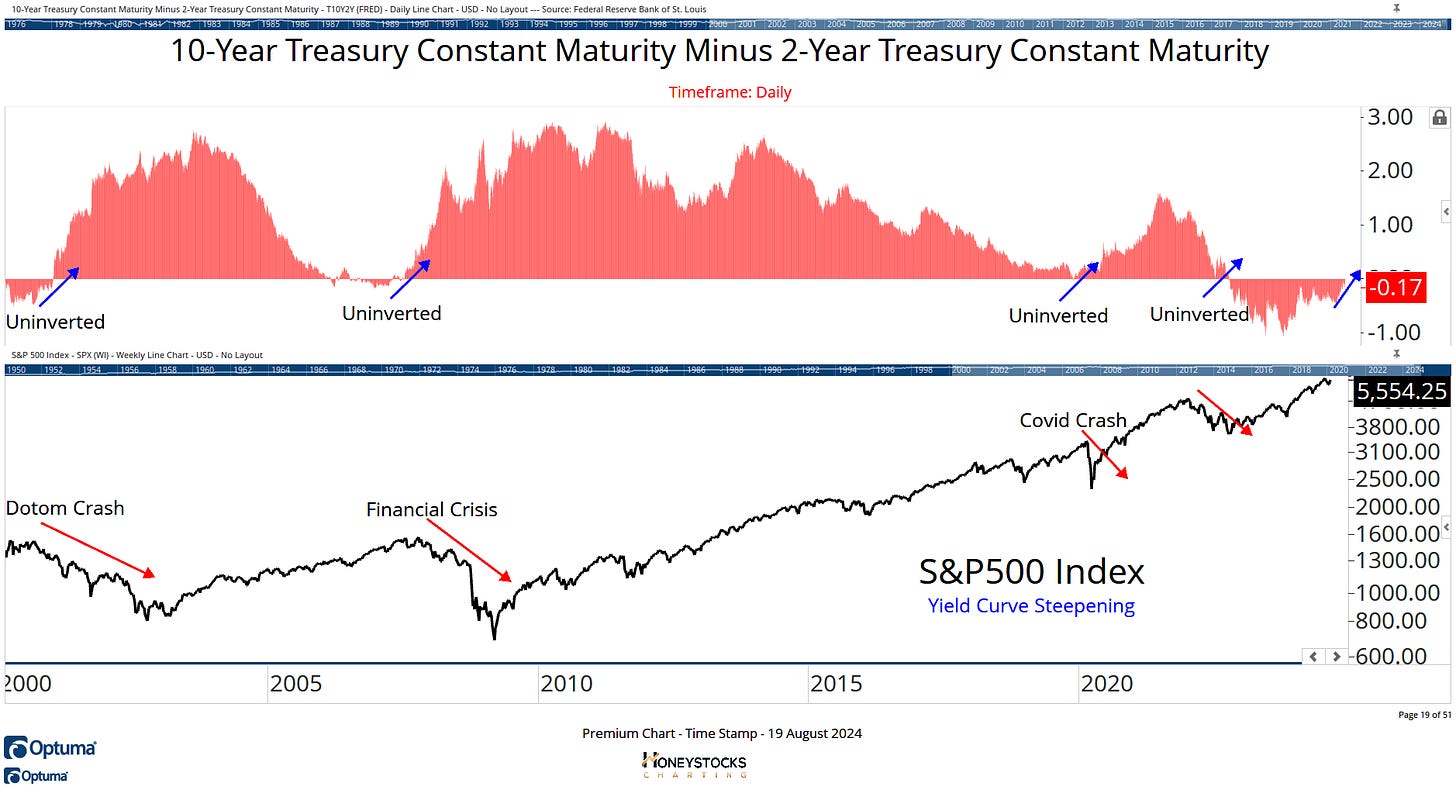
Yield Curve / S&P500
The Yield Curve is probably the scariest chart I have just now and at the height of the VIX spike, we were threatening to un-invert but we have retreated somewhat the last 10 days so I’m still working with a buyable dip thesis.
Nvidia Corp (NVDA)
Nvidia was 1st port of call for us at $102.
It’s been terrific and we’re now back above another key level and 3/4 of the way towards our previous all time highs target level.
I expect a little chop/digestion over the next week, but I’m hopeful the highlighted levels hold and we ultimately achieve target.
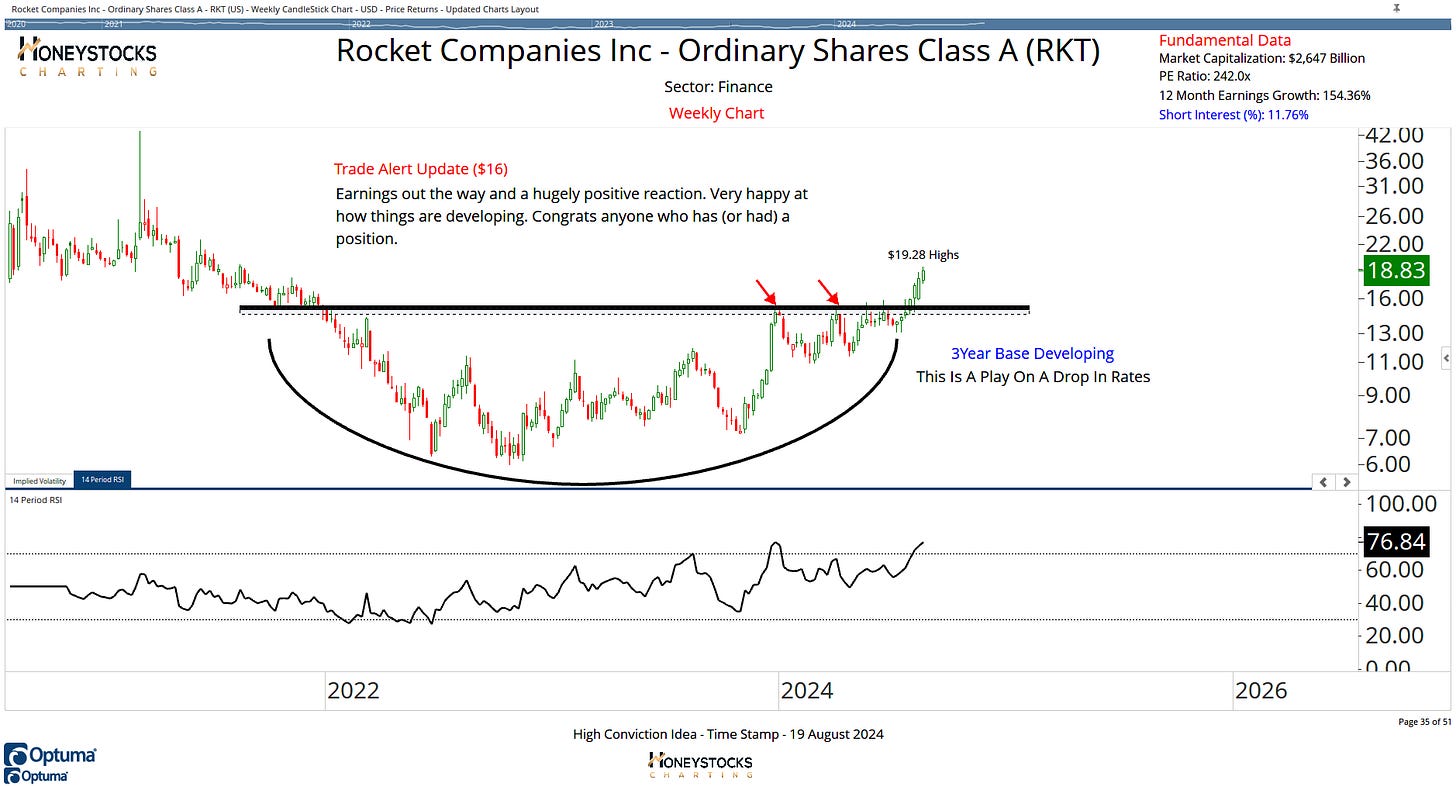
Rocket Companies (RKT)
Another 1 of our high conviction ideas has been great and our play on the Fed cutting rates in the 2nd half of the year.
It’s already +20% and this might be as far as it goes, but if you missed the logical entry a few weeks ago, a pull back MIGHT offer opportunity.
Block Inc (SQ)
1 of the 12 premium charts sent to our members this weekend is for Block and while the chart pattern isn’t quite confirmed, if you like buy low: sell high opportunities and like front running the sheepy relative strength gurus with their CMT designations, perhaps the chart is appealing.
In Summary
There’s always a scary headline, every single week there’s an economic report or a news event designed to part you with your investment thesis.
I recommend having access to the best charts.
It’s easier when you have folks who can keep things rational during irrational times.
Have a great week everyone.
I’ll post again when I feel like I have something important to say.


