Please do consider forwarding to like-minded folks and sharing with your social media followers it would be hugely appreciated, it’s free.
What can we expect going into year end? Can we buy the dips? What are the charts saying?
Are we in a new bull market, or are we dealing with nothing more than a bear market rally?
Sooooo many questions to answer, but before I get to some big charts this week, here’s my hot take.
There are lots of stocks in massive uptrends and lots of stocks in massive down trends, so why not focus on the individual risk : reward propositions provided by each chart?
I already covered a LOT last weekend in our market deep dive (Video Analysis Linked Below) but if you’re new to my work, my last 2 letters might give some context.
9th October - Are Stocks Ready To Rip Higher
30th October - To The Moon We Go
Let’s start this week with an update to the riskiest areas of the market.
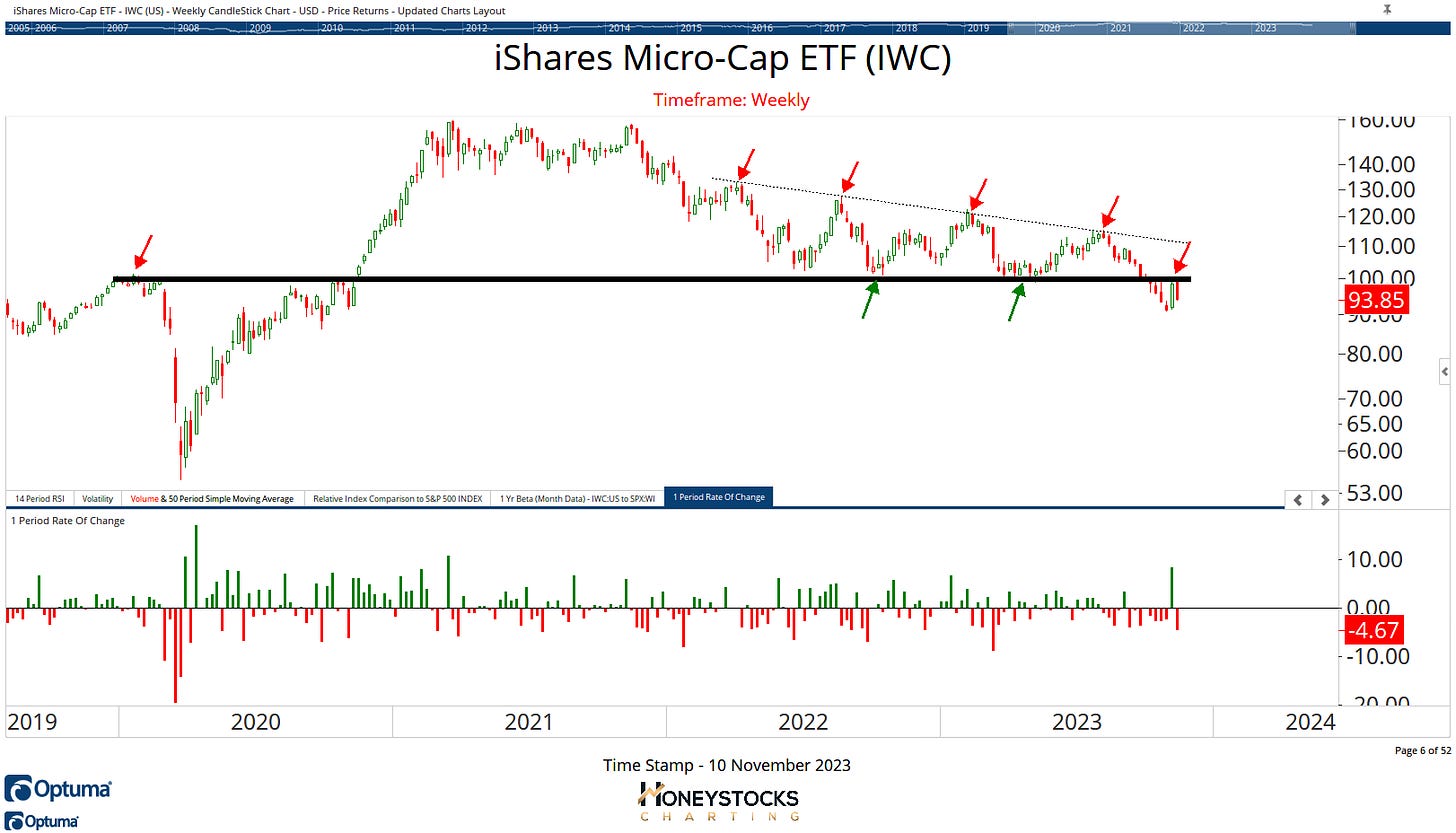
iShares Micro Cap ETF (IWC)
The problem with the chart above is that we’re still below significant technical price levels.
I know many of the riskiest areas of the market are randomly capable of ripping 20-30% on nothing more than fumes, but what the chart is currently saying is the market is telling us to stay away from risky names, and focus more on quality.
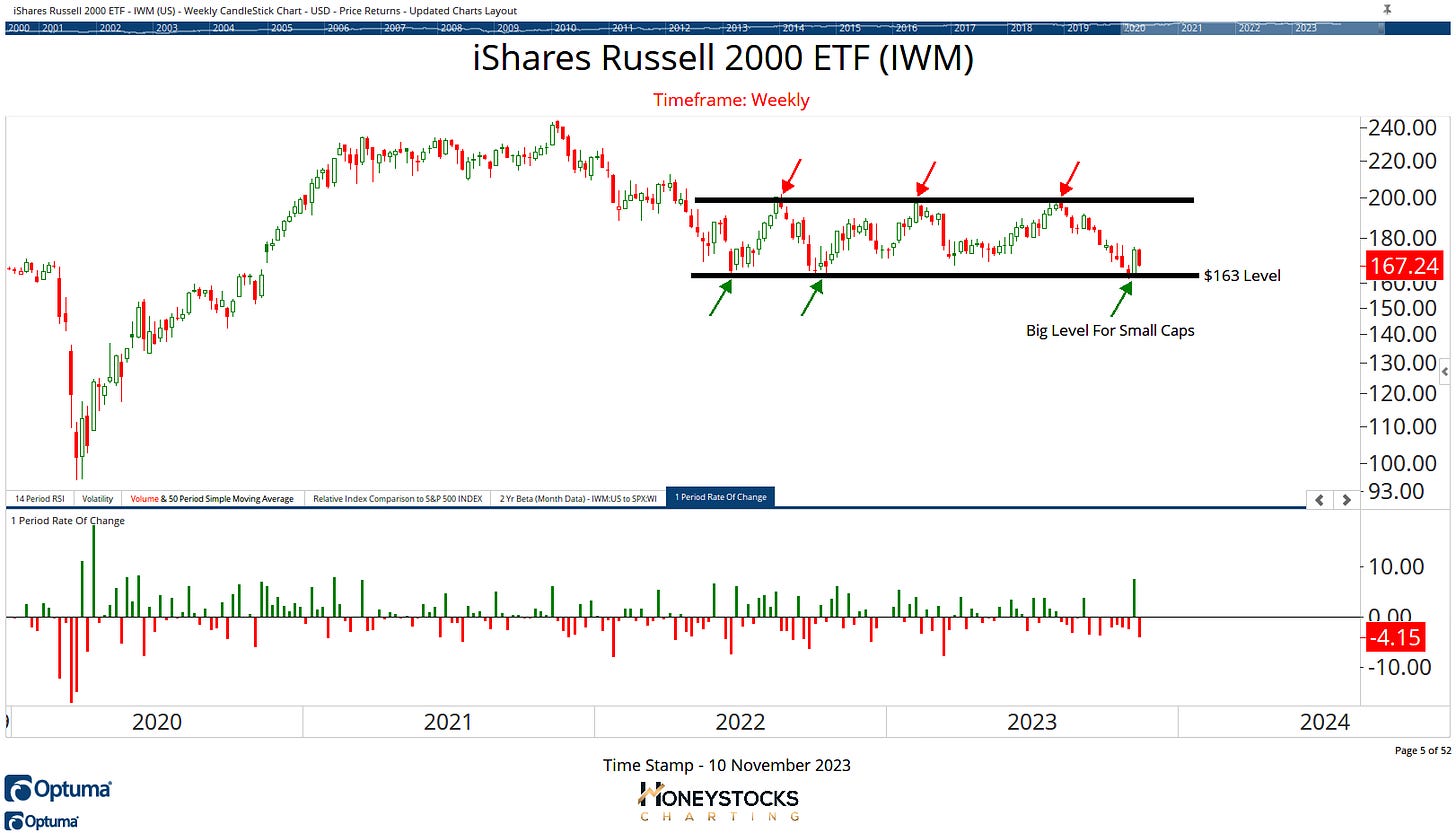
iShares Russell 2000 ETF (IWM)
Over the last few days I’ve received quite a few messages and emails telling me small caps had “bottomed” and they’re all fair game again.
Let me be clear about something, I LOVE buy low : sell high charts just like the chart above, I absolutely love them.
I’m not 1 of those relative strength gurus who fixates on buying stocks at all time highs, in fact, I think it’s the dumbest thing in the world to only buy all time highs coming out of a correction.
The issue with the chart above is the strength of the move last week and what can typically happen in the weeks following… the chart above was provided to our members LAST week highlighting this, so I’m not quite there with buying individual small caps because they’re more than capable of tanking 30% overnight, but if you’re tempted by the ETF’s aligned with small caps…
Bullish above $163….. Not so bullish below…..?
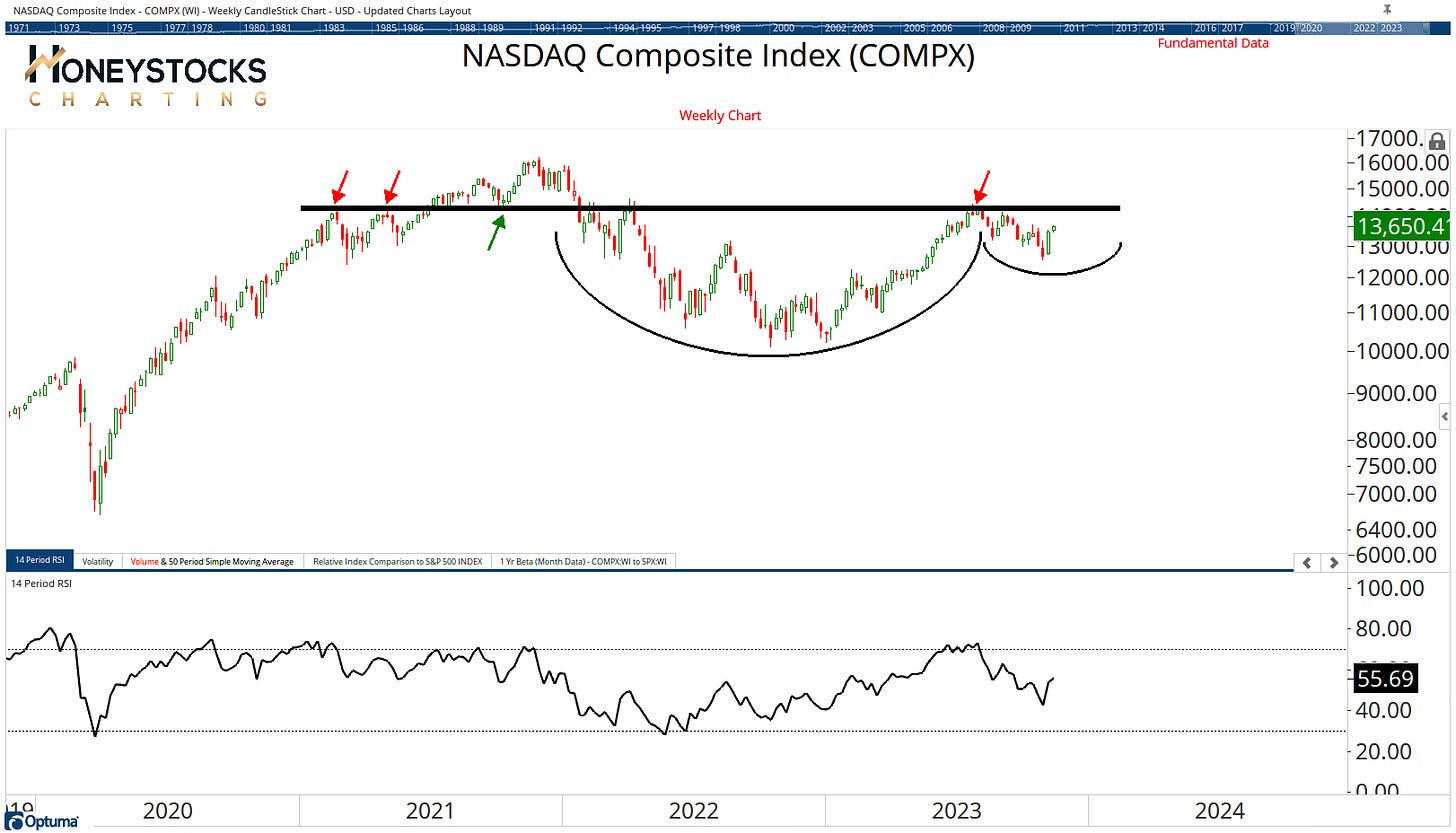
Nasdaq Composite Index
How about the Nasdaq Composite Index?
Does it look like a bullish or a bearish chart?
I also laid out a BUNCH of trade ideas and broader market charts below in our monthly deep dive, I’d encourage you to check that out.
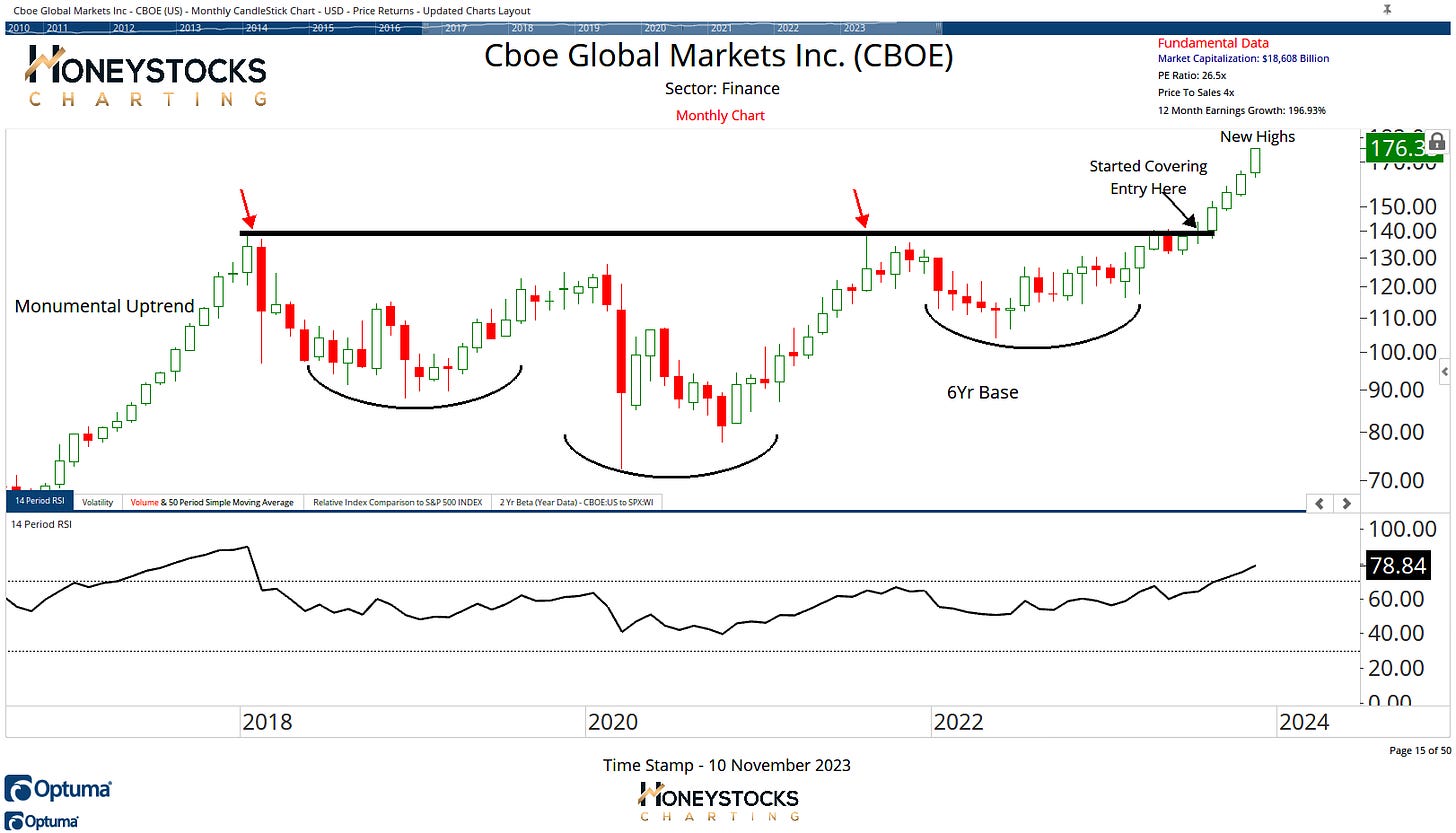
Cboe Global Markets Inc
The dummies of Wall Street keep telling everyone it’s only 7 stocks going up… these folks need to be avoided at ALL costs, and in an ideal world they need to be stripped of whatever 3 letters they have after their names.
CBOE continues to work unbelievably well.
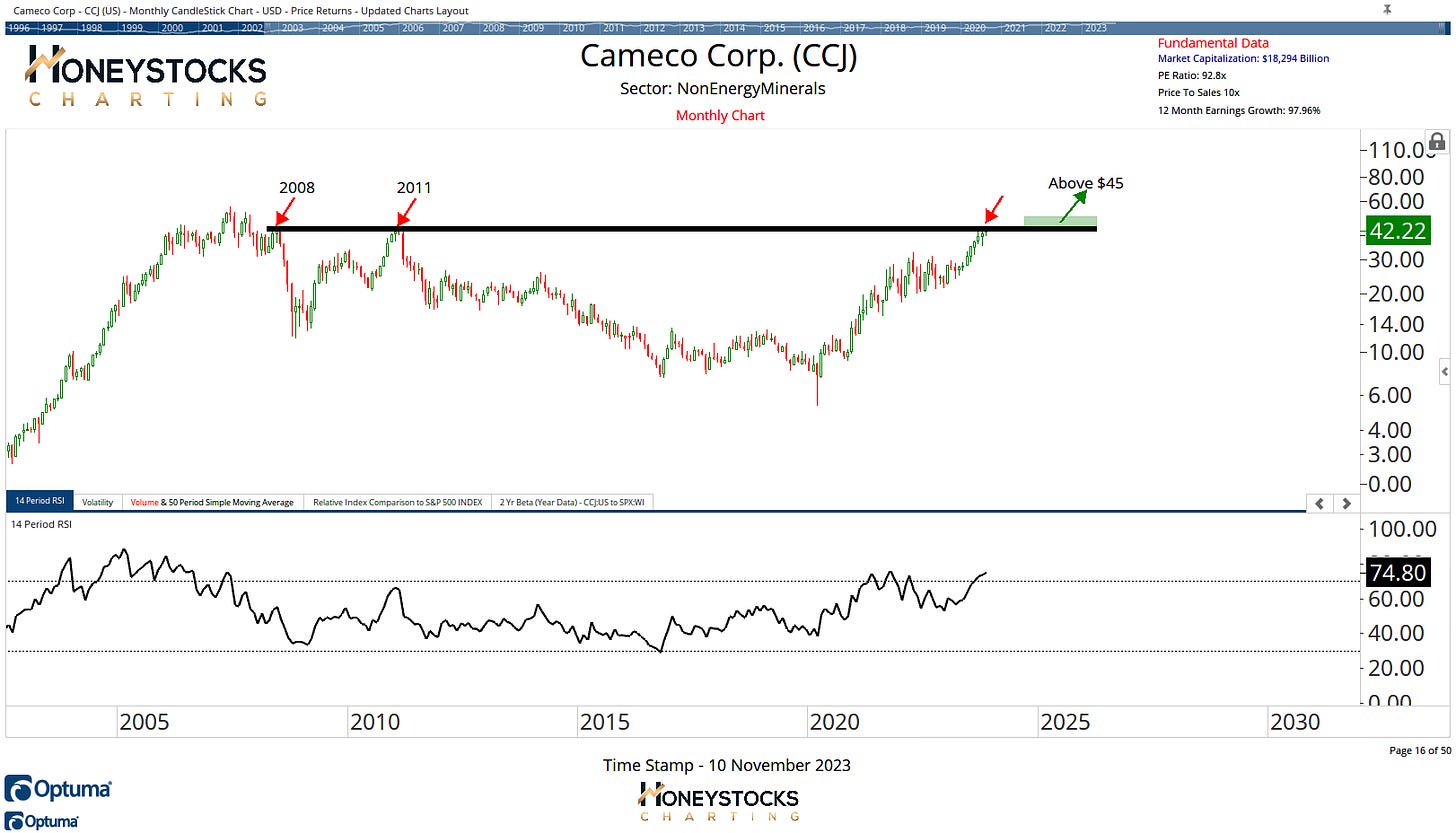
Cameco Corp (CCJ)
CCJ already hit our 30% upside objectives last month but it’s back on our radar given the strength being shown again this week, above $45 it could get interesting again.
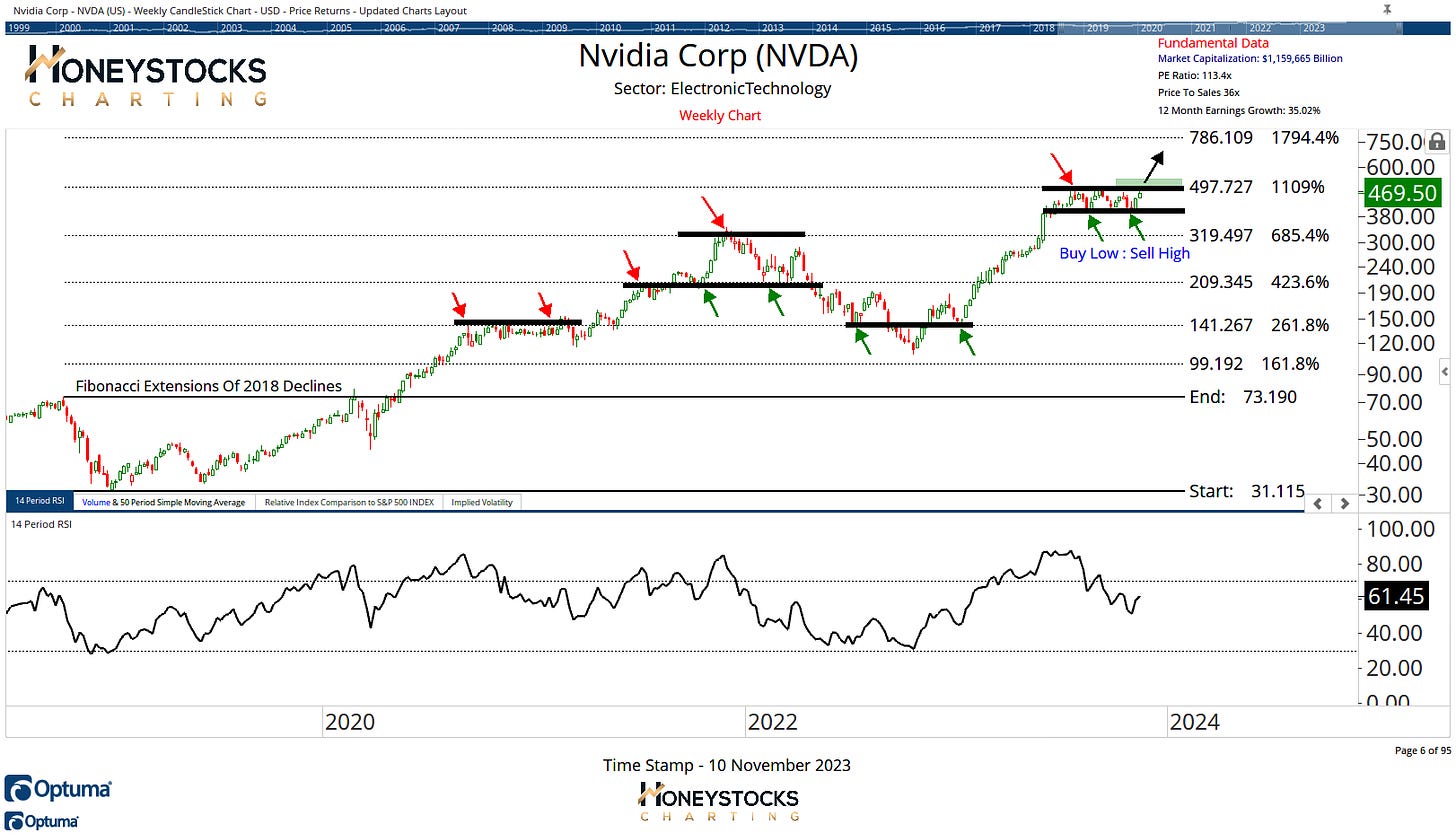
Nvidia Corp (NVDA)
Is the biggest semiconductor on the planet gearing up for another break out above $500?
In Conclusion
Spending any time whatsoever thinking about or labelling something a bull market or a bear market isn’t going to help your investment decisions.
It’s just how it is.
There are plenty of stocks you can buy, and there are plenty of stocks you can short, and it’s just the nature of the current market environment.
On a stock by stock basis, my work is now approaching upside targets in many of the buy low : sell high mega cap tech names we’ve been bullish over the last month.
I know for many, there’s probably a source of frustration at missing out on some of those moves in the likes of Amazon, Microsoft or Meta, and if that’s the case, I’d encourage you to turn off the news, focus on the charts, and maybe consider subscribing to our premium work below.
See you next week.


